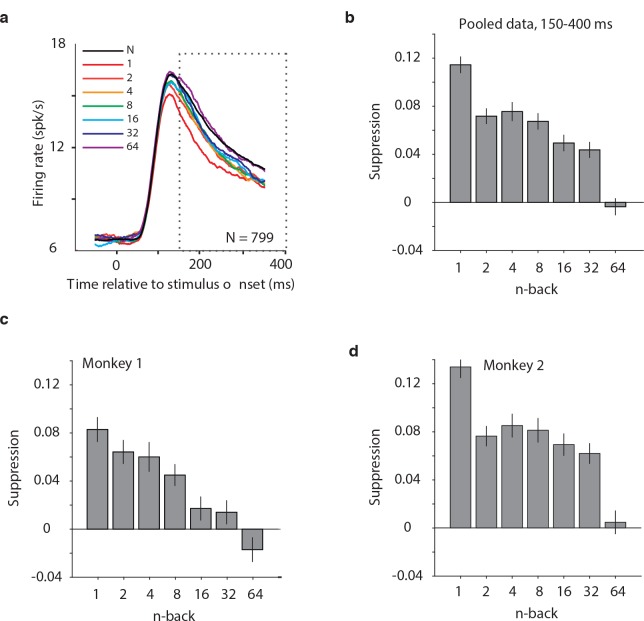
Figure 5. Average IT repetition suppression magnitudes.
(a) Grand mean firing rates for all units, plotted as a function of time aligned to stimulus onset, parsed by images presented as novel (black) versus familiar at different n-back (rainbow). Traces were computed in 1 ms bins and smoothed by averaging across 50 ms. The dotted box indicates the spike count window corresponding to the analysis presented in panels (b–d). The absence of data at the edges of the plot (−50:−25 ms and 375:400 ms) reflects that the data are plotted relative to the centers of each 50 ms bin and data were not analyzed before −50 ms or after the onset of the go cue at 400 ms. (b) The calculation of suppression magnitude at each n-back began by quantifying the grand mean firing rate response to novel and familiar images within a window positioned 150 ms to 400 ms after stimulus onset. Suppression magnitude was calculated separately for each n-back as (novel – familiar)/novel. (c–d) Suppression magnitudes at each n-back, computed as described for panel b but isolated to the units recorded in each monkey individually. Error reflects SEM.

