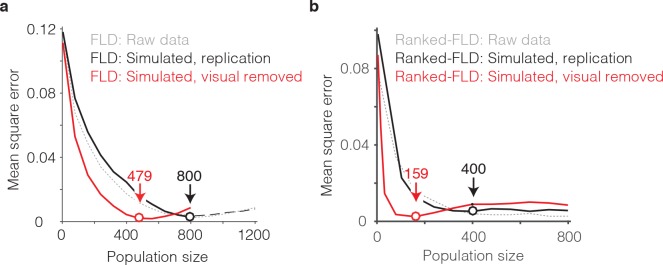
Figure 9. The impact of visual selectivity.
(a) FLD behavioral prediction error trajectories for the actual data (gray, replotted from Figure 6g), a simulated replication of the data in which both the visual selectivity and the visual memory signals for each unit were replicated (black), and a simulated version of the data in which the visual memory signals were preserved for each unit but visual selectivity was removed (see Materials and methods). (b) The same three FLD behavioral prediction error trajectories, computed with a ranked-FLD.

