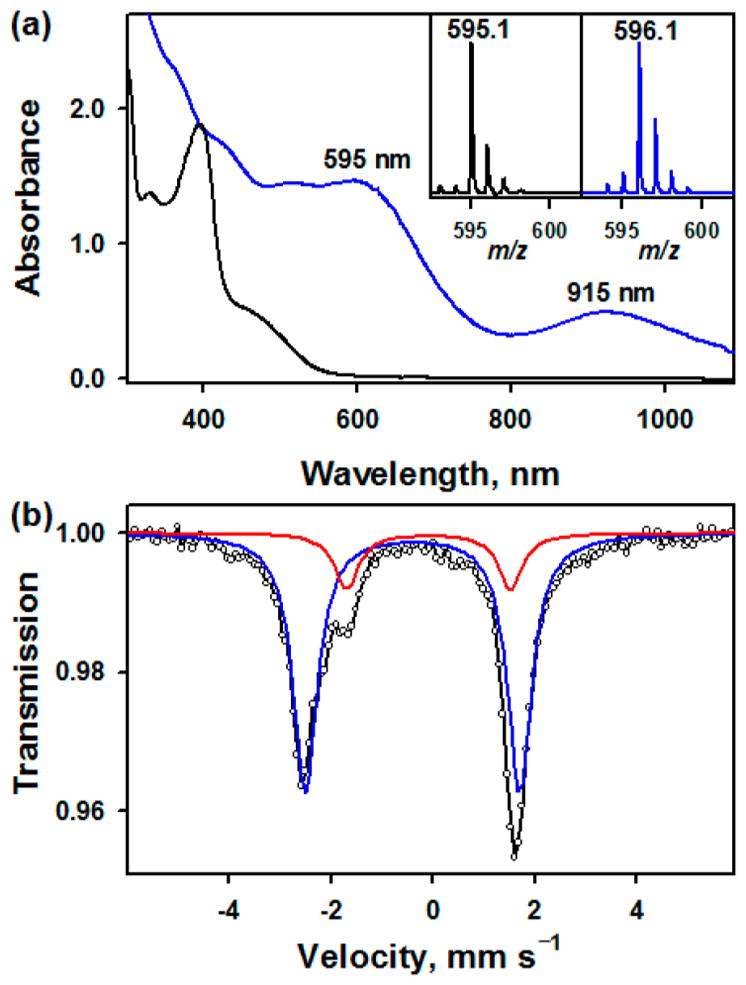
Figure 1.

(a) UV–vis spectra of [FeIII(TAML)]− (0.25 mM; black line) and 1 (blue line) produced by reacting [FeIII(TAML)]− (0.25 mM) with solid PhINTs (3 equiv) in CH3CN at 15 °C. Insets show CSI-MS spectra with the isotopic distribution patterns of the peaks at m/z of 595.1 for 1—14NTs (left panel) and m/z of 596.1 for 1—15NTs (right panel). (b) Mössbauer spectrum (black dotted line) for 1 recorded at 6 K and 0 T. The black solid line is a superposition of the simulated 1 (85%, blue line) and the decay product of 1 (15%, red line) (see Figures S4 and S5).
