
Figure 2.
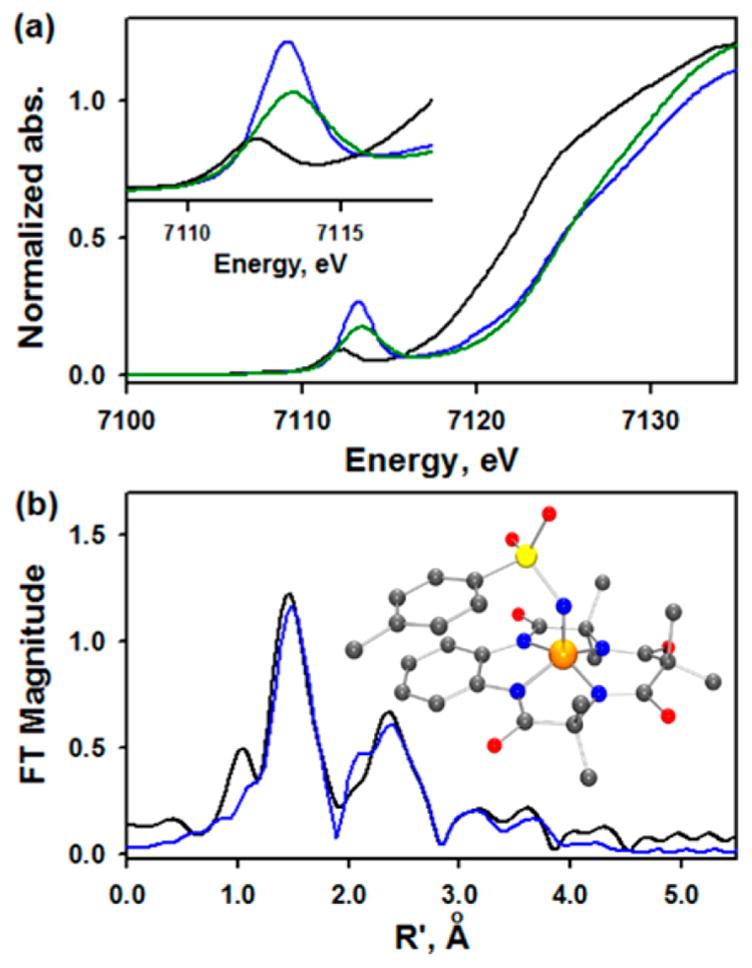
(a) XAS data of 1 (pre-edge = 51 units) (blue line), [FeIII(TAML)]− (black line), and 70% [(TAML)FeV(O)]− (48 units, fit of this pre-edge is given in Figure S7) (green line). Inset shows the expansion of pre-edge region. (b) Fourier transform of 1 (black line) with fits (blue line). Raw EXAFS data are in Figure S10. The EXAFS data were fit with 30% FeIV decay, consistent with parallel Mössbauer data. Inset shows the DFT-optimized structure of 1.