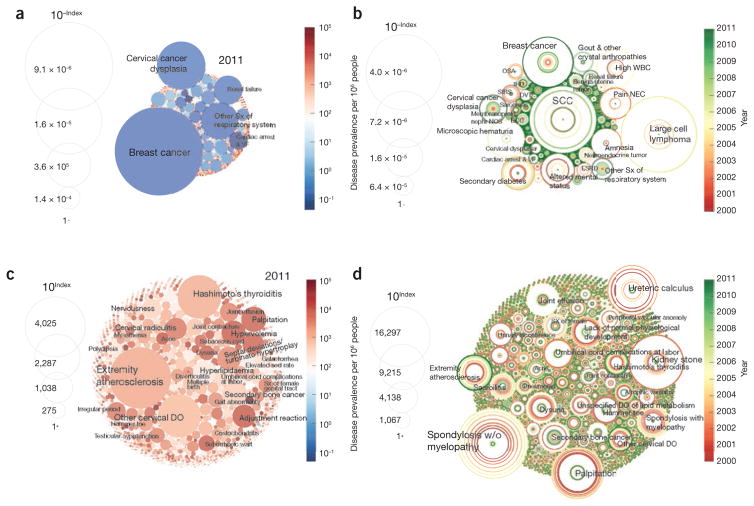
Figure 1.
Health ROI for overstudied and understudied conditions (see Supplementary Table 5 for the top 50 over- and understudied conditions in 2011). (a,b) The area of each circle is inversely proportional to the opportunity index of the corresponding disease, indicating disproportionately overstudied conditions in 2011 (a) and in the period of 2000–2011 (b). (c,d) Circle area is directly proportional to opportunity index, indicating understudied, high-opportunity conditions in 2011 (c) and in the period of 2000–2011 (d). Sx, symptoms; VF, ventricular fibrillation; sed rate, sedimentation rate; DO, disorder; W/O, without; ESRD, end-stage renal disease; BCC, basal cell carcinoma; NOS, not otherwise specified/unspecified; SIRS, systemic inflammatory response syndrome; DVT, deep vein thrombosis; IHD, ischemic heart disease; OSA, obstructive sleep apnea; WBC, white blood cell; NEC, not elsewhere classified.

