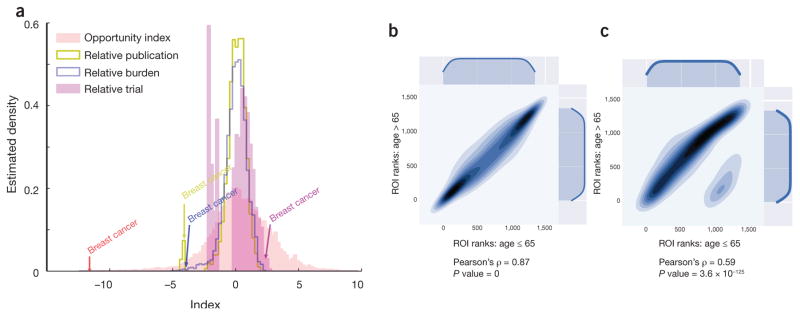
Figure 2.
Disease-specific health ROIs. (a) Optum, (b) the University of Chicago Medical Center and (c) the National (Nationwide) Inpatient Samples data sets. (a) Distribution of ROI (red line) superimposed with distributions of relative disease burden (blue line), relative publications (yellow line), and relative clinical trials (magenta). The disease-specific ROIs follow an approximately normal distribution that is by definition zero-centered. For ease of comparison, relative disease burdens, relative publications and relative clinical trials are log-transformed and shifted to center at zero—by subtracting the index sample mean from each index value. In the case of breast cancer, the relative disease burden is approximately aligned with the relative publication focus on breast cancer, but not with the relative clinical trial value. As a result, the ROI for breast cancer is negative, which means the resources devoted to it exceed the disease burden. Computed for Optum. (b,c) Comparison of disease-specific ROI ranks for patients of ≤ 65 and >65 years old in the University of Chicago Hospital data (b) and the National (Nationwide) Inpatient Samples (NIS). (c) Both plots show statistically significant correlation between the two populations: the Pearson correlation coefficients equal 0.87 for University of Chicago Hospital data and 0.59 for the NIS. Health ROIs can be computed and meaningfully compared for the same population at different time points or for different populations.

