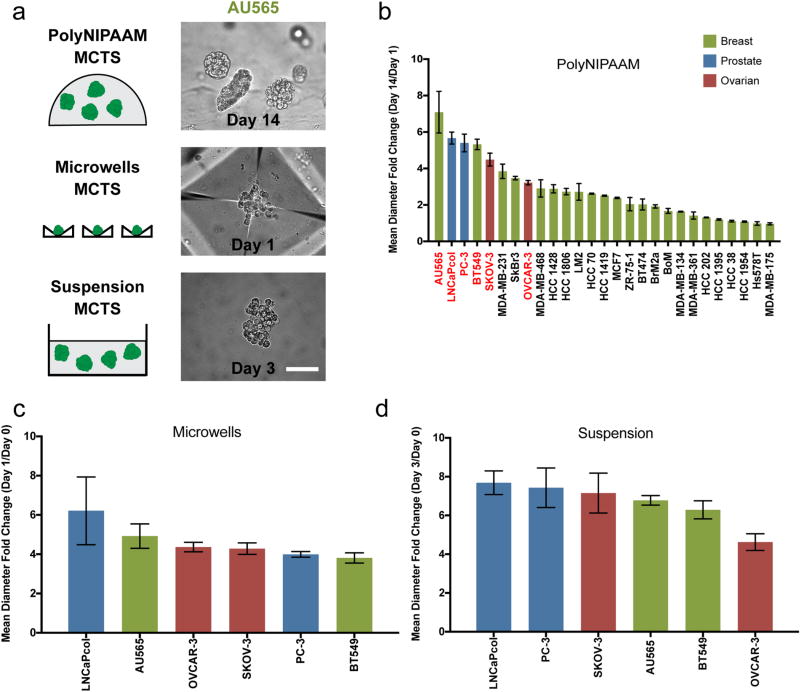
Figure 1.
PolyNIPAAM, microwells, and suspension methods generate diverse MCTS. (a) Schematic of methods used to form MCTS and representative images of AU565 MCTS formed by each method. Scale bar: 100 µm. (b) Mean diameter fold change of 23 breast (green), 2 prostate (blue), and 2 ovarian (red) cancer cell lines into MCTS in polyNIPAAM (cell lines highlighted in red were used in c and d) N ≥ 2. (c, d) Mean diameter fold change of 2 breast (green), 2 prostate (blue), and 2 ovarian (red) cancer cell lines into MCTS in microwells (c) and suspension (d) N ≥ 3. Mean diameter fold change shows how MCTS diameters changed over time. ANOVA followed by Tukey post-test was used to compare statistically significant differences across methods for each cell line: SKOV-3 (polyNIPAAM vs suspension*) and (microwells vs suspension*), and PC3 (microwells vs suspension**).

