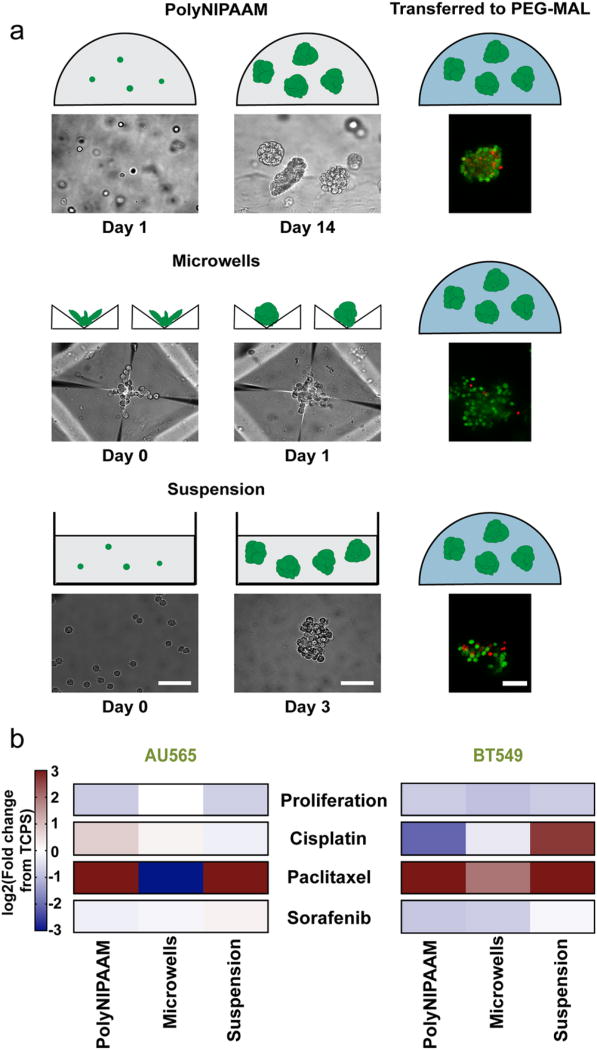
Figure 3.
MCTS method formation dictates drug response. (a) Schematic of MCTS formation by polyNIPAAM, microwells, and suspension followed by encapsulation in 10 wt % 3D PEG-MAL hydrogels. Representative brightfield and live/dead images of MCTS (green, live cells; red, dead cells) are shown under each. Scale bar: 100 µm. (b) Heatmap of proliferation and GR50 values of cisplatin, paclitaxel, and sorafenib in AU565 and BT549 cell lines. Values reported as log2(fold change from TCPS). Shades of red indicate higher drug resistance compared to TCPS, and shades of blue indicate higher drug sensitivity compared to TCPS, N ≥ 3.

