Figure 1.
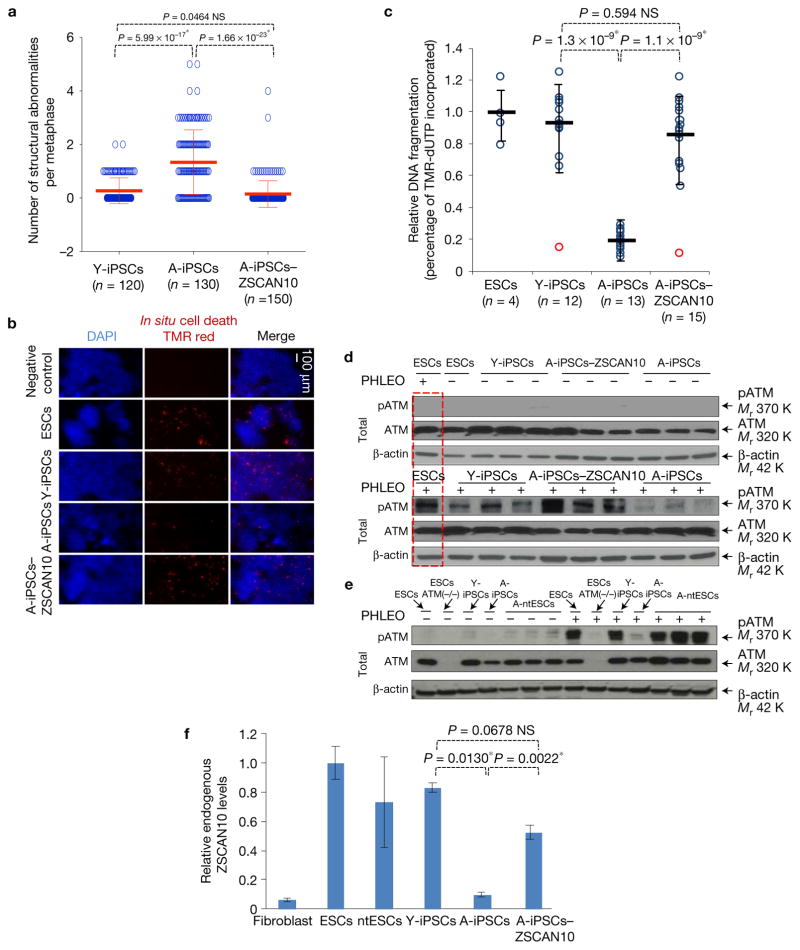
Impaired genomic integrity and DNA damage response of mouse A-iPSCs compared with Y-iPSCs and ESCs, and recovery following transient expression of ZSCAN10. (a) Structural abnormalities observed by cytogenetic analysis in each A-iPSC clone, and recovery with ZSCAN10 expression. The error bars indicate s.e.m. of independent clones analysed per group. Numbers n represent individual metaphases, values are provided in the figure and source data are in Supplementary Table 5. Statistical significance by two-sided t-test followed by post hoc Holm–Bonferroni correction for a significance level of 0.05, * indicates significant and NS not significant. (b) In situ cell death assays of ESCs, Y-iPSCs, A-iPSCs and A-iPSCs–ZSCAN10 were carried out 15 h after phleomycin treatment (PHLEO; 2 h, 30 μg ml−1). A-iPSCs show less staining for cell death. The negative control is Y-iPSCs treated with dye in the absence of enzymatic reaction. The scale bar indicates 100 μm. DAPI, 4,6-diamidino-2-phenylindole. (c) Quantification by image analysis of apoptotic response by DNA fragmentation assay. The error bars indicate s.e.m. of technical and biological replicates. The number of biological replicates is indicated below each group in the figure. Statistical significance by two-sided t-test followed by post hoc Holm–Bonferroni correction for a significance level of 0.05; * indicates significant and NS not significant (Supplementary Table 5). (d) Reduced pATM in A-iPSCs as monitored by immunoblot after phleomycin treatment (2 h, 30 μg ml−1), and recovery of ATM activation following ZSCAN10 expression. The red box indicates the same ESC sample loaded in both immunoblots as an internal control. (e) pATM immunoblot illustrating the differential DNA damage response of A-ntESCs and A-iPSCs generated from an aged tissue donor. Three independent clones of A-ntESCs show a normal DNA damage response after phleomycin treatment. (f) qPCR of ZSCAN10 mRNA levels showing poor activation of ZSCAN10 expression in A-iPSCs and complete activation with transient expression of ZSCAN10. Endogenous ZSCAN10 levels normalized to β-actin. Error bars indicate s.e.m. of two replicates with three independent clones in each sample group (n = 6). Statistical significance by two-sided t-test followed by post hoc Holm–Bonferroni correction for a significance level of 0.05; * indicates significant and NS not significant. Unprocessed original scans of blots are shown in Supplementary Fig. 7.

