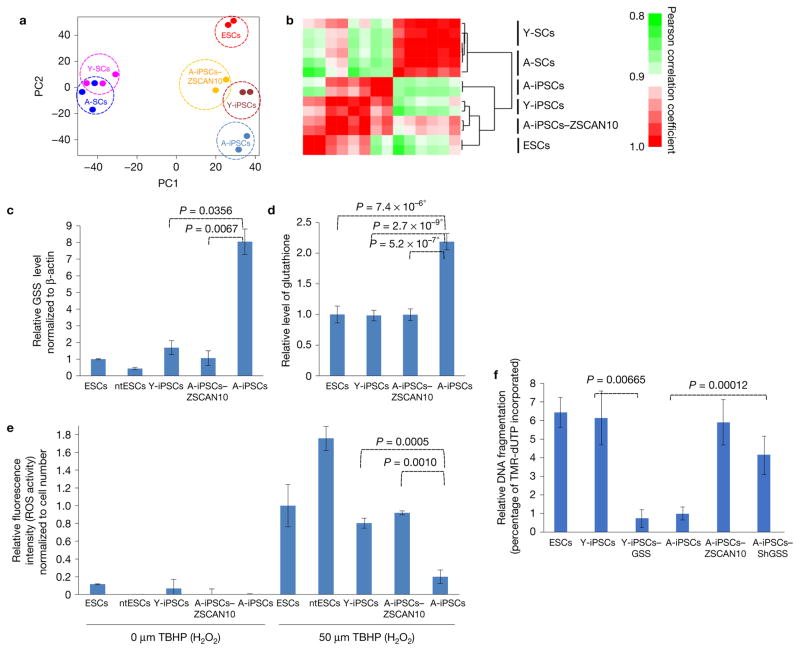
Figure 3.
Imbalance of ROS–glutathione homeostasis in mouse A-iPSCs, and recovery by ZSCAN10 expression via reduction of GSS. (a,b) Whole-genome expression profiles of aged and young fibroblast cells (A-SCs and Y-SCs) and pluripotent cell lines (ESCs, Y-iPSCs, A-iPSC and A-iPSCs–ZSCAN10) with independent clones for each line as biological repeats (n ≥ 2). (a) Principal component (PC) analysis using whole-genome expression profiles. (b) Heatmap showing hierarchical clustering of samples and pairwise gene expression similarities measured using Pearson correlation coefficient. (c) qPCR of GSS mRNA levels, indicating excessive expression in A-iPSCs and downregulation with ZSCAN10 expression. The error bars indicate s.e.m. of two replicates with three independent clones in each group (n = 6). Statistical significance by two-sided t-test followed by post hoc Holm–Bonferroni correction for a significance level of 0.05 (Supplementary Table 5). (d) High levels of glutathione in A-iPSCs, and recovery by ZSCAN10 expression. Mean ± s.d. is plotted for four biological replicates with two independent clones in each group (n = 8). Statistical significance was determined by two-sided t-test; * indicates significant. (e) ROS scavenging activity. A-iPSCs show strong H2O2 scavenging activity, with reduced response against treatment with tert-butyl hydrogen peroxide (TBHP); the response is recovered by ZSCAN10 expression. Mean ± s.d. is plotted for three independent clones in each group (n = 3). Statistical significance by two-sided t-test (Supplementary Table 5). (f) Apoptosis assay in A-iPSCs with GSS shRNA expression and Y-iPSCs–GSS by image quantification. A lower apoptotic response is seen 15 h after the end of phleomycin treatment (2 h, 30 μg ml−1) in A-iPSCs and in Y-iPSCs–GSS, and is recovered with GSS downregulation in A-iPSCs. The error bars indicate s.e.m. of three biological replicates with two independent clones in each group (n = 6). Statistical significance by two-sided t-test (Supplementary Table 5).

