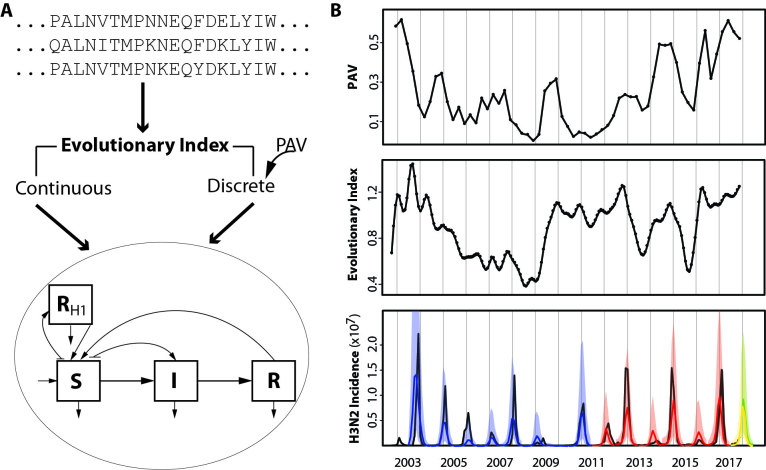
Model and Forecasts.
(A) Workflow of the EvoEpiFlu model. The evolutionary index is calculated as a weighted sum of sequence distances (based on epitope sites of HA) to compare strains each month to strains in the past, with distances weighted by a decay function back in time. Another approach relies on a discrete version of evolutionary change and is based on a previously-published genotype-phenotype map5 , producing the proportion of antigenic variants (PAV) over time. In order to make the forecast, two versions of the model were developed that incorporate the evolutionary index either in continuous or discrete form (in the continuous model and discrete model respectively). These quantities are included as covariates in a modified SIRS formulation for the transmission dynamics of the disease (tracking three main classes of individuals, S for susceptible, I for infected and infectious, and R for recovered and immune, as well as an additional class for immune to H1N1, which is informed by observed H1N1 incidence). In the models, evolutionary change determines the rate of return of immune individuals to the susceptible class, mimicking a loss of protection as the virus evolves. (B) Model evolutionary components and forecasts (based on available data up to November, 2017 at the time of publication). Top panel: PAV calculated for strains in each quarter compared to strains in the past 12 months. Middle panel: the evolutionary index calculated monthly. Bottom panel: the H3N2 incidence forecast based on data up to June, 2017 for the upcoming 2017-2018 season in the US based on the cluster version of EvoEpiFlu is shown in yellow. An updated forecast using data up to November 2017 is also shown in green. The observed data are indicated in black, with observed data for the 2017-2018 season up to December at the time of publication shown with the dotted line; forecasts are color-coded with their corresponding 95% uncertainty intervals, with blue for leave-one-out cross-validation, red for one-season-ahead forecasting (for out-of-fit data), and for the real-time forecast of the 2016-2017 season. For model details see4 , from which the forecasts up to 2016-2017 are taken.

