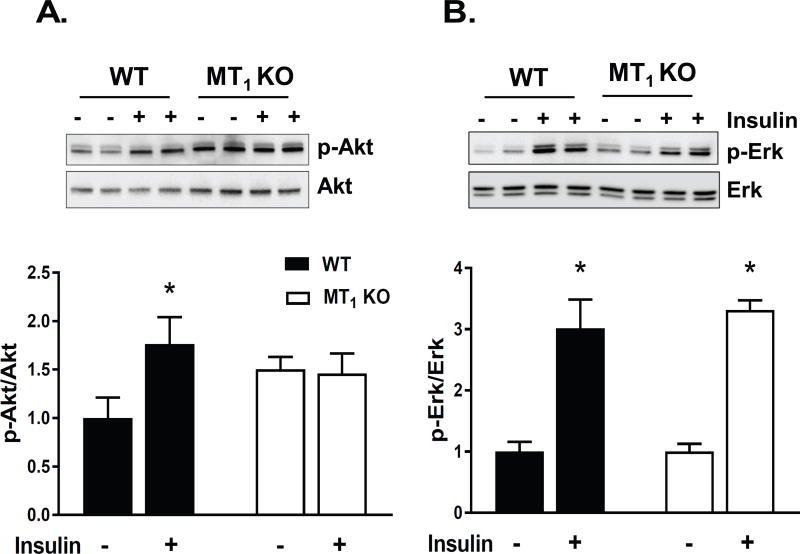
Fig 3. MT1 KO mice exhibit impaired insulin signaling in vivo.
Insulin sensitive tissues from WT, and MT1 KO mice were collected 0 and 15 min post insulin injection (n=3–5) at ZT6. Immunoblotting was performed to quantify the relative amount of p-AKT(Thr308), and Total AKT. Representative blots are shown for (A) Adipose tissue, (B) Liver, and (C) Skeletal Muscle. Corresponding densitometric quantification plots for p-AKT/AKT are shown in the bottom panels. Results are expressed as mean ± SEM (n=4–5; t-tests *p<0.05).

