
Figure 3.
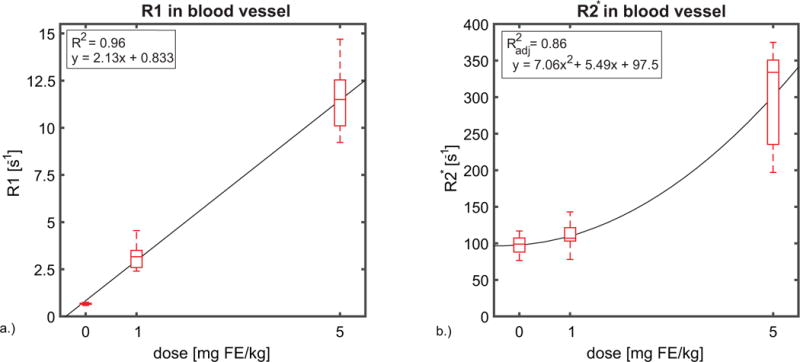
Box plots showing the a.) R1 and b.) R2* changes observed in ROI’s in a blood vessel (superior sagittal sinus) across all subjects (n=20). In large vessels, R1 in blood exhibits a linear response to dose of ferumoxytol with R2 = 0.96 for the linear fit. While, R2* exhibits a non-linear response to dose, in contrast with a linear relationship between dose and R2* found in tissue. A quadratic model fit the data best with an adjusted coefficient of determination R2adj = 0.86. The superior sagittal sinus was selected to perform blood measurements in order to decrease the variance and possible sources of error. These sources of error include flow induced errors, B1 differences, B0 inhomogeneities and partial volume effects.