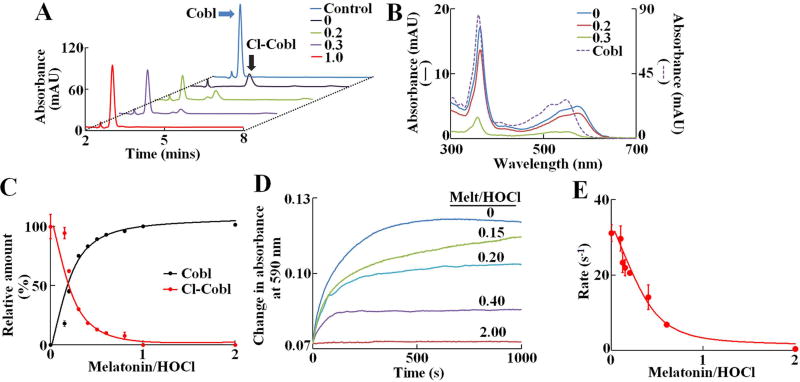
Figure 2. Melatonin prevents HOCl mediated α-axial ligand replacement and subsequent formation of Cl-cyanocobalamin.
(A) HPLC analysis of cyanocobalamin-HOCl reaction mixtures in presence different molar ratios of melatonin:HOCl (ratios shown in inset). Chromatograms were monitored at 360 nm. The position of the cyanocobalamin and Cl-cyanocobalamin peaks are marked by blue and black arrows, respectively. The data shown is a representative of three independent experiments. (B) UV-Vis spectra of the cyanocobalamin (dotted line) and Cl- cyanocobalamin (solid lines) peaks, as obtained from the diode array detector. The Cl-cyanocobalamin spectra was plotted as a function of melatonin:HOCl molar ratios (ratios shown in inset). (C) Relative amount of cyanocobalamin and Cl- cyanocobalamin as calculated from the area under the curve for each peaks, were plotted as a function of melatonin:HOCl molar ratios. For cyanocobalamin, the area under the curve for cyanocobalamin alone was defined as 100 %, while for Cl- cyanocobalamin, the area under the curve at 0 melatonin was defined as 100 % and subsequent areas were normalized to those values. The data points are the average of three independent experiments, and the error bars represent the standard error of measurements. (D) Kinetic traces for the cyanocobalamin-HOCl reaction monitored at 590 nm, showing the formation of Cl-cyanocobalamin, as a function of different molar ratios of melatonin:HOCl. These data are average of three independent experiments. (E) Pseudo-first order rate constants of formation of Cl-cyanocobalamin, plotted as a function of melatonin:HOCl molar ratios. The data points are the average of three independent experiments, and the error bars represent the standard error of measurements.

