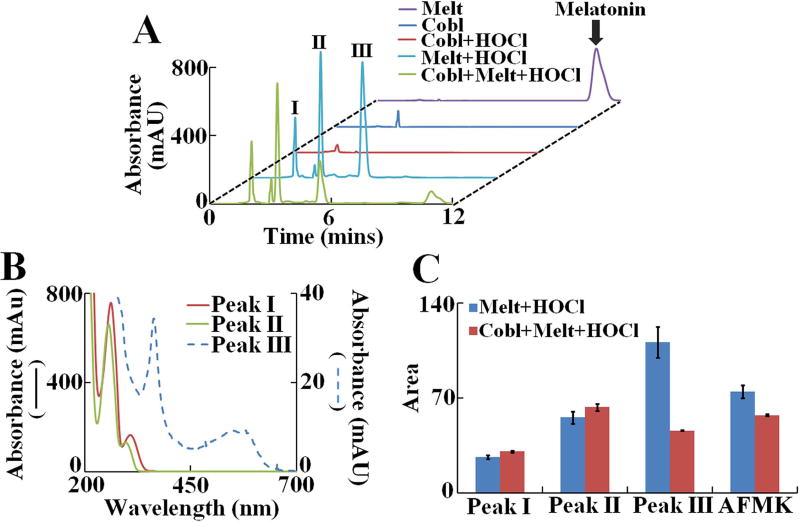
Figure 4. Analysis of melatonin oxidation products generated when melatonin was oxidized by HOCl in presence or absence of cyanocobalamin.
(A) HPLC analysis of melatonin oxidation products generated by HOCl in presence and absence of cyanocobalamin. Final concentration of reactants cyanocobalamin (10 µM), melatonin (1000 µM) and HOCl (1000 µM). Chromatograms were monitored at 260 nm. The peak corresponding to unreacted melatonin is labeled as “Melatonin”. Three other, major UV absorbing peaks are labeled as I, II and III respectively. The data shown is a representative of three independent experiments. (B) UV-Vis spectrum of peak I, II and III as obtained from the diode array detector. (C) Relative amount of each product generated as calculated from the area under the curve for each peak. AFMK was detected via fluorescence detector (chromatogram not shown) as mentioned in the Materials and Methods section. The data shown is a representative of three independent experiments and the error bars are represent the standard error of measurements.

