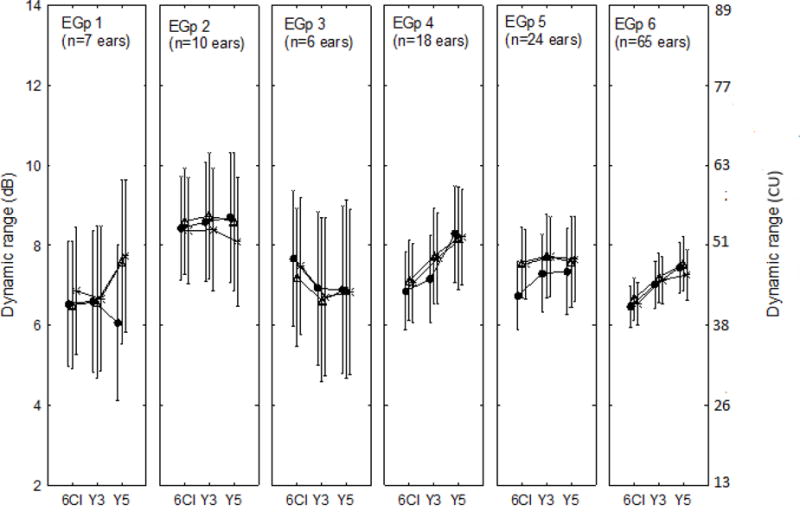
Figure 3.

Dynamic range averaged across electrodes at basal (filled circles), medial (open triangles), and apical (asterisks) regions in CIs used by children at 6-months post-activation (6CI), and at chronological ages of 3 (Y3) and 5 years (Y5). The values for 6 etiology groups (EGp) are shown in separate panels. The 6 groups are: 1) auditory nerve deficiency; 2) cochlear lesions, 3) enlarged vestibular aqueduct; 4) auditory neuropathy spectrum disorder; 5) additional disabilities; and 6) Other (unknown etiology, genetic factors, and cytomegalovirus infection). DRs are denoted in charge in dB units (re:1nC) on the left y-axis and in clinical units CU (re:CIC4 implant and 25 μs pulse width) on the right y-axis of the graph. Vertical bars denote 95% confidence intervals.
