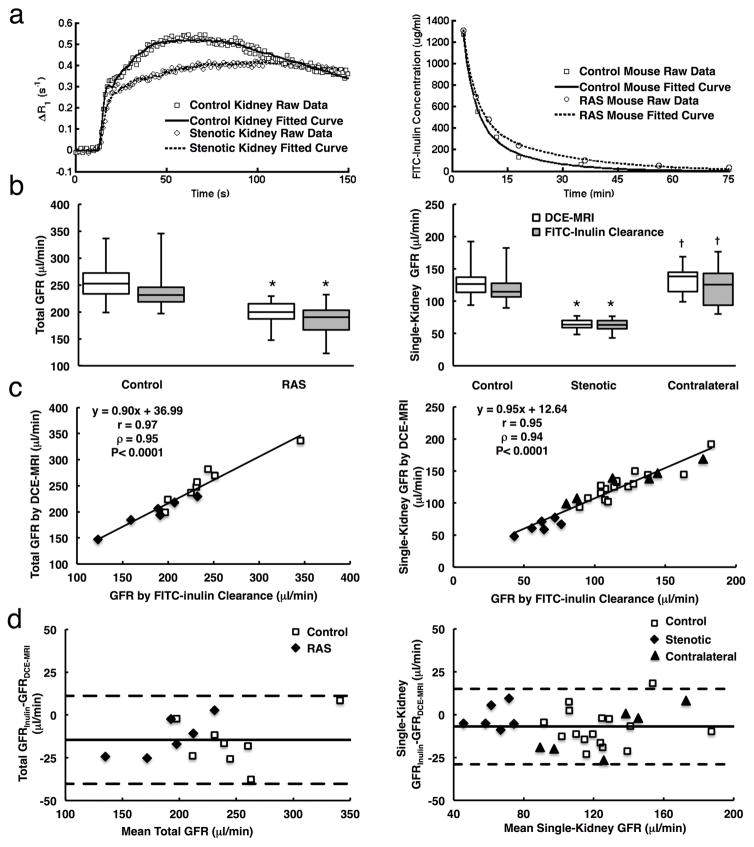
Figure 3. Validation of GFR measurement by DCE-MRI using FITC-inulin clearance.
a. Representative experimentally measured and model-fitted gadolinium dynamics in control and stenotic kidneys, and dynamics of FITC-inulin clearance from plasma in control (blue) and RAS (red) mice. b. Total (left) and single-kidney (right) GFRs measured by DCE-MRI and FITC-inulin clearance in control and RAS mice. c. Correlation between DCE-MRI and FITC-inulin clearance in measuring total (left) and single-kidney (right) GFRs. d. Bland-Altman analysis of total (left) and single-kidney (right) GFR measurements by DCE-MRI and FITC-inulin clearance. *P<0.05 compared to control kidney, †P<0.05 compared to stenotic kidney.

