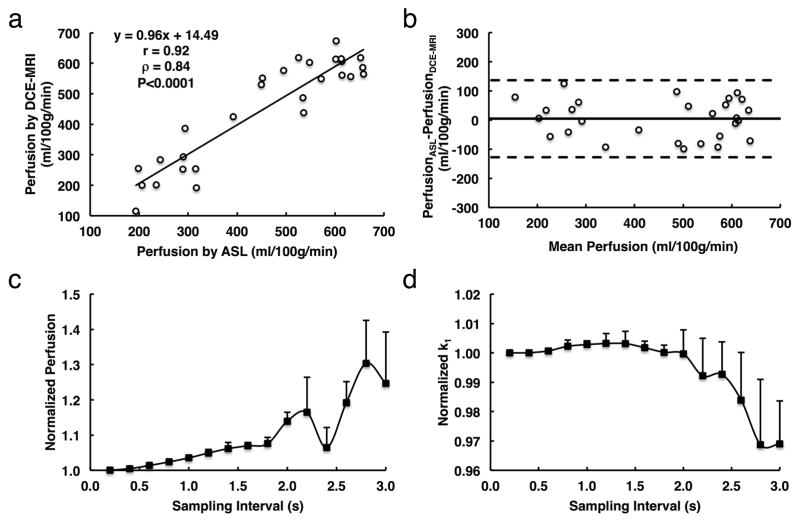
Figure 4. Validation of perfusion measurement by DCE-MRI and the impact of sampling interval on measurement of GFR and renal perfusion.
a. Correlation between renal perfusion by DCE-MRI and arterial spin labeling (ASL). b. Bland-Altman analysis of the same data. c and d. Monte-Carlo simulation of the impact of sampling interval on measurement of renal perfusion (c) and GFR (d). Large variations in estimated GFR and renal perfusion are observed when the sampling interval is larger than 1.8 and 2.0s, respectively.

