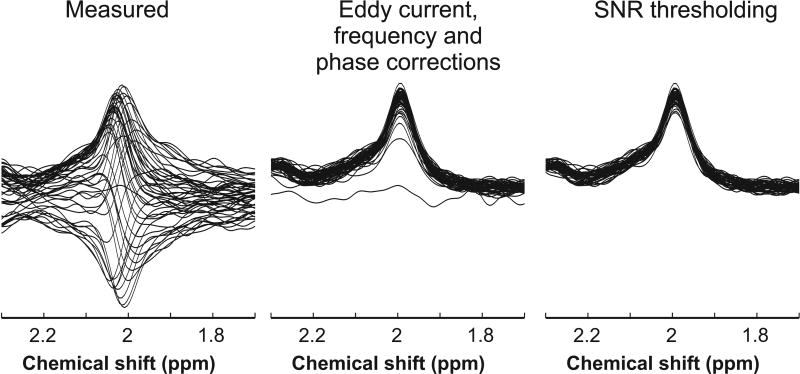
Figure 2.
Stacked plot of NAA singlet at 2 ppm measured in one diffusion direction with STEAM from one subject; 48 individually measured spectra (left panel), spectra after eddy current, frequency, and phase corrections (middle panel), and the resulting individual spectra after removing low SNR spectra as described in the text (right panel).

