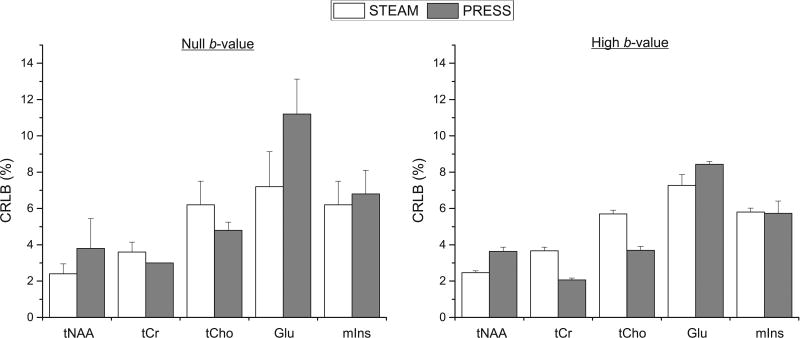
Figure 4.
Average CRLBs of the 5 main metabolites for STEAM (TE/TM = 21.2/105 ms) and PRESS (TE = 54.2 ms) sequences at different b-values (16 averages for null b-value and 48 averages for high b-value). At high b-value, the average CRLBs from all 6 directions are shown. Error bars represent standard deviation.

