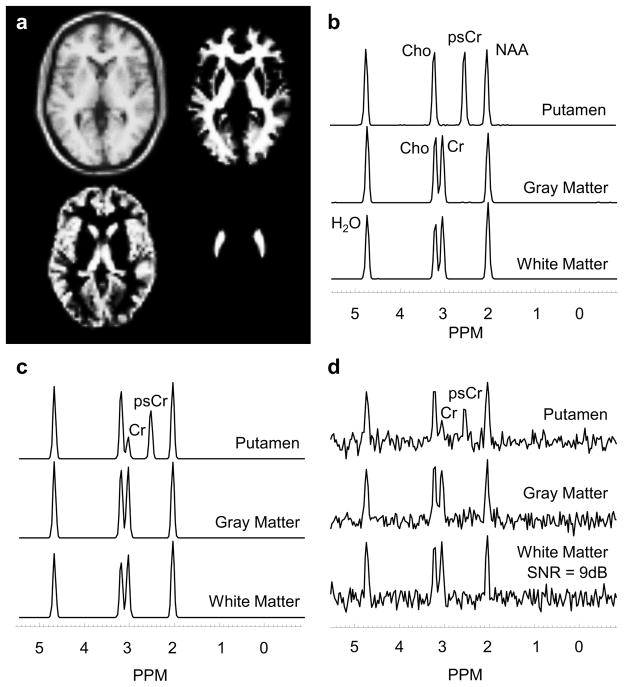
Figure 1.
a) Simulated brain model showing white and gray-matter regions and the putamen. Simulated spectral signatures are shown for each region, with b) zero noise and no spatial smoothing, c) zero noise and a spatial smoothing of σ = 2.0 and d) a noise level of 4 and a spatial smoothing of σ = 2.0.

