
Figure 1.
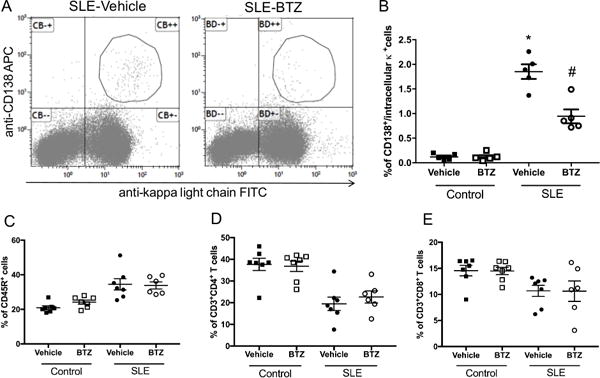
Effect of bortezomib treatment on bone marrow plasma cells in control and SLE mice. A, Representative dot plots of SLE mice treated with vehicle or bortezomib. Cells were isolated from femurs at the conclusion of the study and stained with anti-mouse CD138 and anti-mouse kappa light chain mAbs. Plasma cells are indicated in the figure. B, Percentage of plasma cells in vehicle and bortezomib-treated SLE and control mice. The percentages of plasma cells are higher in SLE mice as compared to control mice and were lowered by bortezomib treatment. *, p<0.0001 vs. all other groups; #, p<0.001 vs. control-vehicle and control-bortezomib. C, Percentage of circulating CD45R+ B cells in vehicle and bortezomib-treated SLE and control mice. D, Percentage of circulating CD3+CD4+ T cells in vehicle and bortezomib-treated SLE and control mice. E, Percentage of circulating CD3+CD8+ T cells in vehicle and bortezomib-treated SLE and control mice.