
Figure 2. Design and characterization of a new MS2-MCP system.
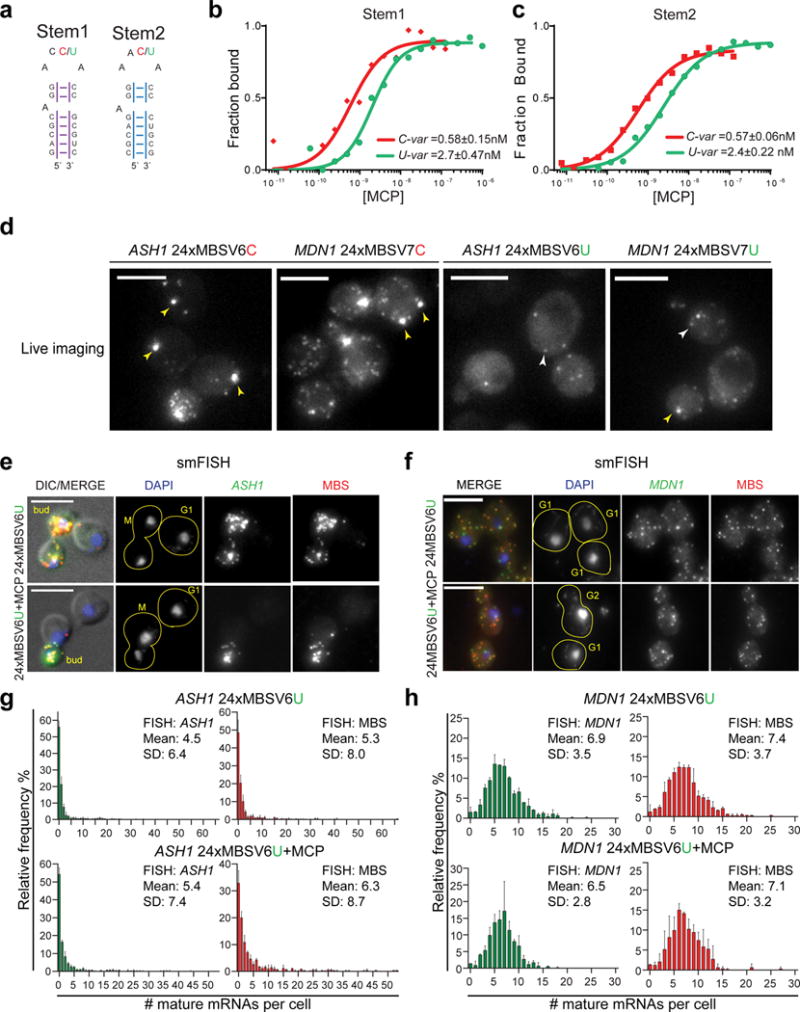
(a) RNA stem loop sequences used for EMSA assays. Stem1 and Stem2 have randomized stem sequence of 7 nts. The two loops were synthetized either as an U-variant or C-variant at position −5. The affinity of MCP for the two stem loops was tested by EMSA.
(b, c) Binding affinity of MCP for the MBS C-variants and U-variants. The Kd from three independent measurements (Figure Supplementary 2f-g) is indicated on the plots for (b) Stem1 and (c) the Stem2, either U or C-variant.
(d) Image of living cells co-expressing MCP. (Left) ASH1 24xMBSV6 C-variant or MDN1 24xMBSV7 C-variant. (Right) ASH1 24xMBSV6 U-variant or MDN1 24xMBSV7 U-variant. Yellow arrows = MBS aggregates. White arrows = single mRNAs. Scale bar = 5μm.
(e, f) Two color smFISH for (e) ASH1 mRNAs and (f) MDN1 mRNAs tagged with 24xMBSV6, in cells expressing MCP or the vector alone. (e) DIC/MERGE shows the overlap of the DAPI (blue), smFISH for the ASH1 CDS (green) and the MBSV6 (red) with the DIC image. (f) MERGE shows the overlap of the DAPI signal (blue), smFISH for the MDN1 CDS (green) and the MBSV6 (red). Yellow lines define the shape of a single cell. For each cell is indicated the cell cycle stage. Scale bar = 5μm.
(g, h) Quantification of smFISH represented in 2e and 2f with CDS probes (green plots) or MBS probes (red plots) reported as frequency distribution of mature (g) ASH1 and (h) MDN1 mRNAs per cell. Mean and SD of independent cell cultures, n =~500 cells per experiment.