
Figure 6. MBSV6-MCP quantitatively reports ASH1 mRNA levels throughout the cell cycle.
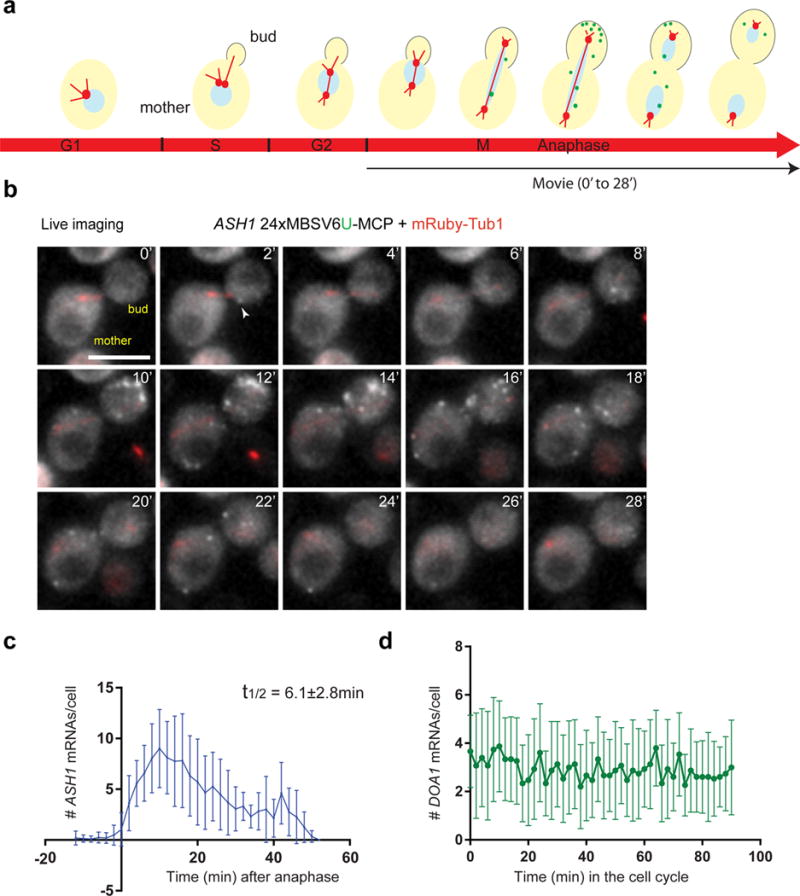
(a) Scheme of ASH1 mRNA expression during the cell cycle (marked on red arrow). Green dots represent ASH1 mRNA. mRubyTub1 (red) marks the spindle pole body, duplicated during S phase. The bud emergence (outlined) starts during S-phase and ends with the formation of the daughter cell. The black arrow indicates the corresponding cell cycle phase of the Video in Figure 6b.
(b) Representative images of Supplementary Video 4. Simultaneous two-color imaging of cells co-expressing ASH1 24xMBSV6-MCP (gray) and mRubyTub1 (red). Time 0 indicates the beginning of anaphase. Images were acquired every 2 minutes. White arrows = single mRNAs. Scale bar = 5μm.
(c) Quantification of single ASH1 mRNAs during the cell cycle. Time 0 indicates the beginning of anaphase (n= 21). During mitosis, ASH1 decayed with a t1/2 of 6.1±2.8 min.
(d) Quantification of single DOA1 mRNAs tagged with 24xMBSV6-MCP during the complete cell cycle (n=15). Images were acquired every 2 minutes (Supplementary Video 4).