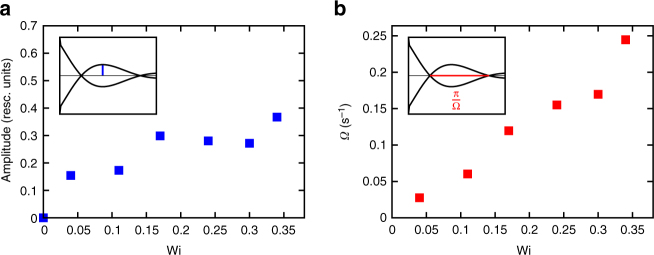
Fig. 4.
Oscillation amplitude and frequency. Oscillation amplitude (a) and frequency (b) of the MCD curves (shown in Fig. 3) vs. Wi. Insets illustrate how these quantities are derived from the experimental data. Both curves decrease with decreasing Weissenberg number, i.e., towards equilibrium. Regarding frequency, this implies that oscillations are particularly slow at small Wi. As the second root is not visible for Wi = 0.04 in Fig. 3, the corresponding value of Ω has been obtained from the time difference between the extremum and the first root

