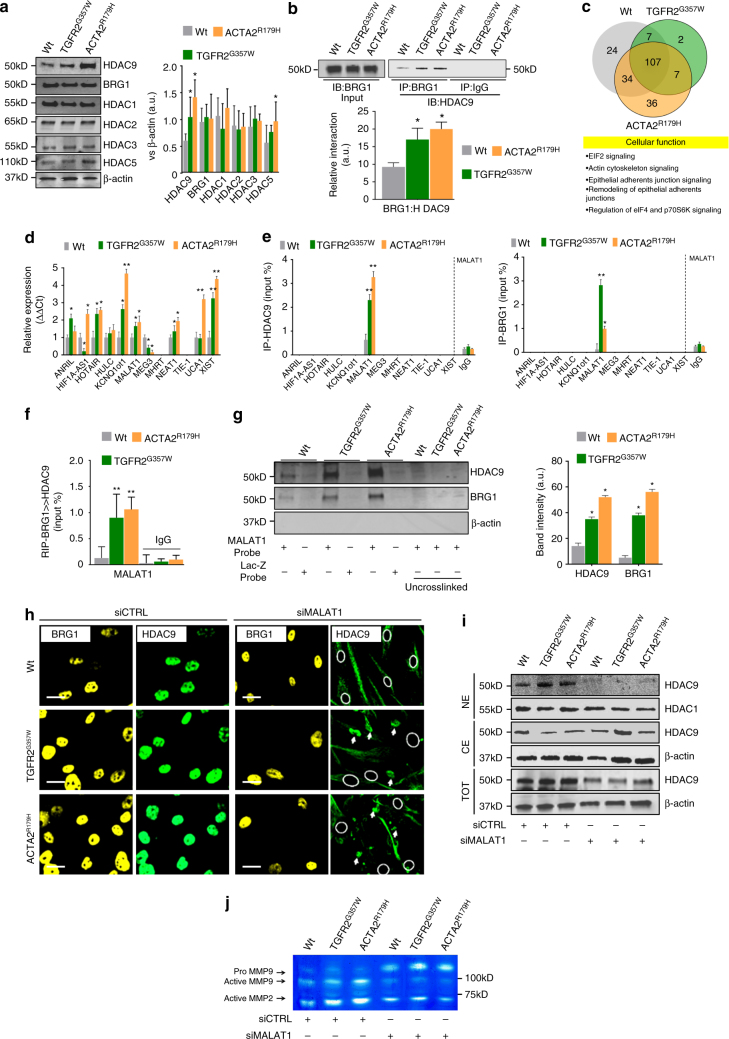
Fig. 3.
HDAC9 interacts with BRG1 and the lncRNA, MALAT1. a Increased expression of HDAC9 protein is noted in TGFR2G357W or ACTA2R179H expressing alleles by western blot when compared to other HDAC isoforms in human VSMCs. Three experimental replicates are quantified. b Immunoprecipitation of BRG1 demonstrates HDAC9 binding in TGFR2G357W and ACTA2R179H expressing mutant cells. Quantification of protein levels of three replicate experiments. c Top, CLIP-seq analysis of anti-HDAC9 and anti-BRG1 immune complexes illustrated by Venn diagram showing the number of transcripts detected by purification with both antibodies at baseline or during expression of TGFR2G357W or ACTA2R179H alleles. Bottom, cellular function of 107 core transcripts by ingenuity pathway analysis. d Quantitative PCR analysis of known cardiovascular lncRNAs during the expression of TGFR2G357W or ACTA2R179H alleles. e Quantitative PCR analysis of cardiovascular lncRNAs associated with either anti-HDAC9 or anti-BRG1 immune complexes. Four experimental replicates are quantified. f Serial immunoprecipitation of BRG1 and HDAC9 demonstrates the association of the lncRNA MALAT1 with BRG1-HDAC9 immunocomplexes. Quantification of protein levels of three replicate experiments. g Western blot analysis of HDAC9 and BRG1 proteins captured through UV crosslinking of bead immobilized biotinylated MALAT1 or LacZ antisense RNA probes. Three replicates are quantified. h Immunofluorescence of HDAC9 and BRG1 demonstrate lack of nuclear localization of HDAC9 in siMALAT1-treated cells. Bar = 15 µM, circles indicate nuclei location in siMALAT-treated cells, arrows indicate apparent cytoplasmic HDAC9 aggregates. i Semiquantitative western blot analysis of HDAC9 and HDAC1 from nuclear extracts (NE) and cytoplasmic extracts (CE) from control and siMALAT1-treated VSMCs. j siMALAT1 treatment of VSMCs decreases TGFR2G357W or ACTA2R179H mediated induction of MMP activity by in vitro gelatin zymography. Bar graphs are presented as mean with error bars (±S.D.), Student’s T-test, *p < 0.05, **p < 0.01 vs. WT. Full-length western blots presented in Supplementary Fig. 8

