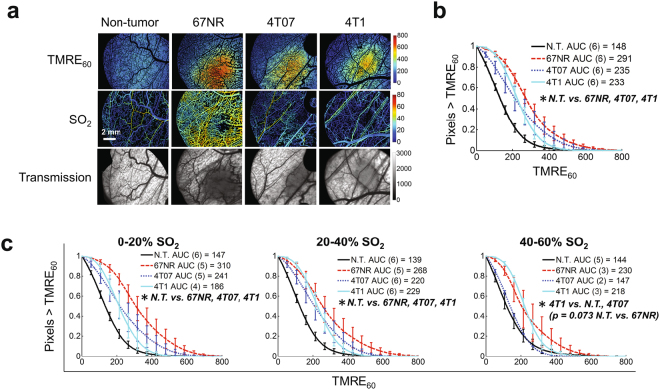
Figure 3.
All tumor types show comparable mitochondrial membrane potential (MMP), and low vascular oxygenation (SO2) enhances differences between tumor and normal MMP. (a) TMRE uptake at 60 minutes (TMRE60) and SO2 in non-tumor and tumor window chambers. Tumor regions are shown in the transmission images as areas of increased absorption contrast. (b) Mean distribution of all TMRE60 pixels for each tissue type. (c) Mean distribution of TMRE60 for each tissue type for distinct levels of regional SO2. Group numbers shown in legend. N.T. = Non-tumor. AUC = area under curve. Error bars = SE. *is p < 0.05.

