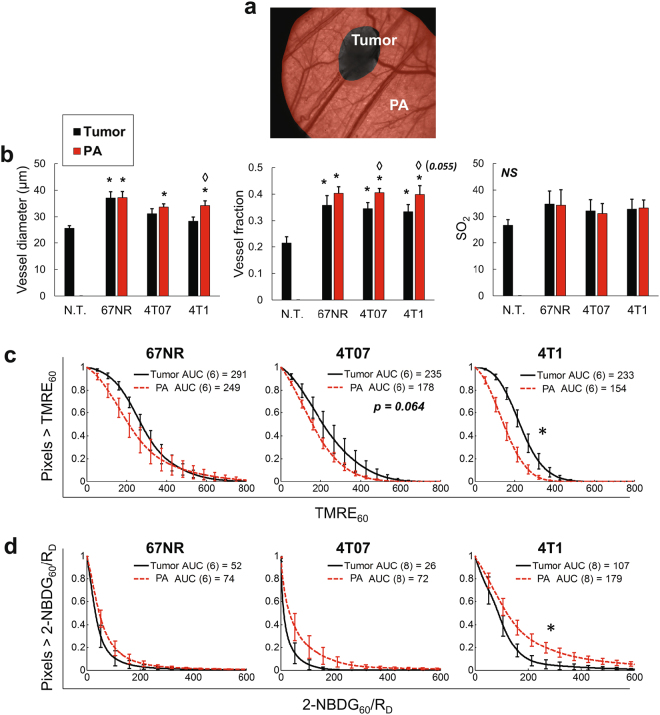
Figure 5.
4T1 tumor and peri-tumoral area maintain distinct metabolic and vascular phenotypes. Metabolic and vascular endpoints were quantified for the tumor and peritumoral area (PA) of all tumor types (67NR, 4T07, 4T1). (a) Transmission images were segmented into tumor and peritumoral area (PA) regions. (b) Comparison of mean vascular features in non-tumor tissue and tumor and PA regions of all tumor types. SO2 = vascular oxygenation. (c) TMRE60 in the tumor and PA of all tumor types. (d) 2-NBDG60/RD in the tumor and PA of all tumor types. N.T. = Non-tumor. AUC = area under curve. Error bars = SE. n = 12-14 (b) or as shown in legend (c,d). *is p < 0.05 vs. N.T. (b). ◊ is p < 0.05 tumor vs. PA for same tumor line (b). *is p < 0.05 tumor vs. PA for same tumor line (c,d).

