Fig. 3.
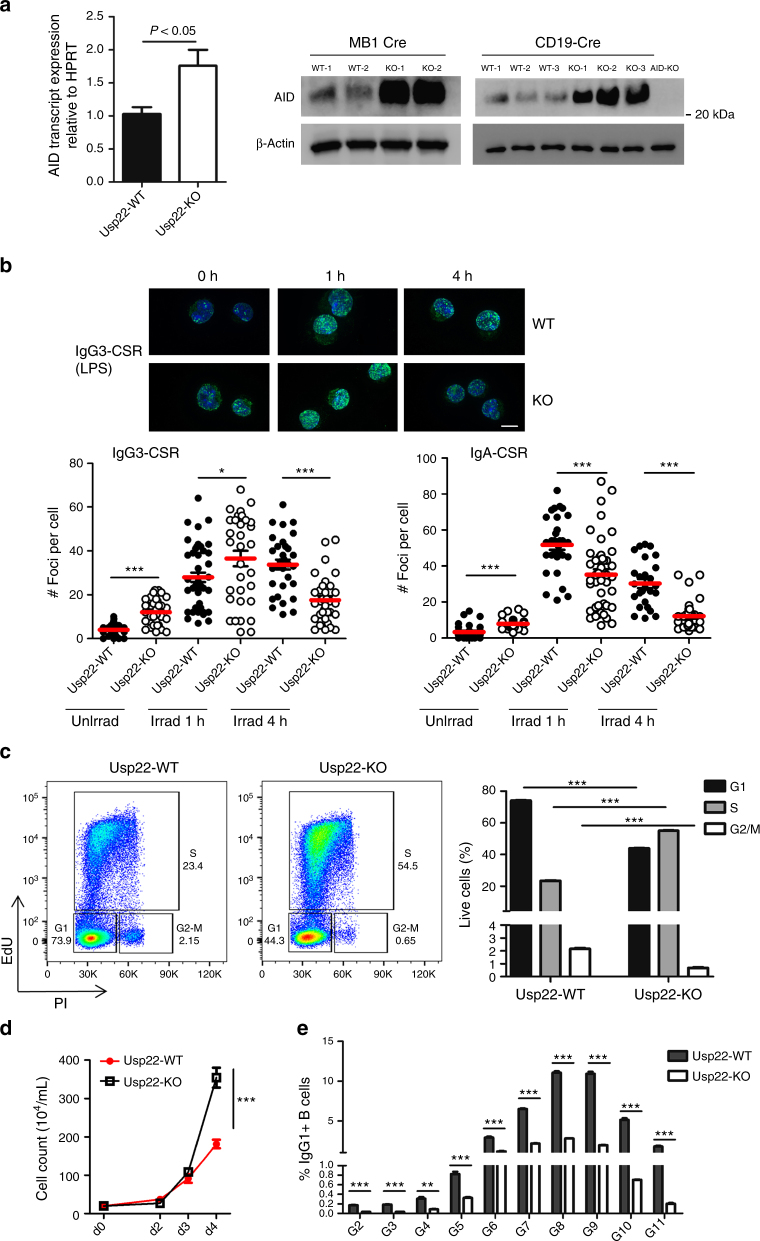
Impaired γH2AX levels in spleen B cells from CD19-cre-Usp22 KO mice. a AID mRNA measured by qPCR of d3-LPS stimulated spleen B cells from CD19-cre-Usp22 KO or WT littermates (left panel; n = 5 mice per group). AID blot analysis of d3-LPS stimulated spleen B cells from Mb1-cre or CD19-cre Usp22 KO or their WT littermates (right panel; n = 2–3 mice per group); AID-KO cells were used as control and data represent two or three independent experiments. b Spleen B cells from CD19-cre-Usp22 KO and WT littermates were stimulated for IgG3 CSR (by LPS) or for IgA CSR (by LPS+ IL-4+ TGF-β+ IL-5+ anti-IgD dextran) for 2.5 days, exposed to γ-radiation, and then collected for γH2AX immunofluorescent staining. Line within micrograph represents 10 μm. The number of γH2AX foci per cell was analyzed 1 or 4 h post irradiation for Usp22-WT (black circles) and CD19-cre-Usp22-KO (white circles) (bottom panel), and representative images for IgG3-CSR group (γH2AX in green and DAPI in blue) are shown in the top panel. Approximately 30–50 cells were analyzed per sample and data represent two or three independent experiments. c Representative flow cytometry plots (left panel) and compiled cell cycle analysis (right panel) of Usp22-WT and CD19-cre-Usp22-KO spleen B cells. Cells were stimulated with LPS for 2.5 days and then incubated with EdU for 4 h, before FACS staining (n = 3 samples per group). d Purified splenic B cells from CD19-cre Usp22-KO or WT littermates was stimulated with LPS and growth of these cells was monitored over time (n = 3 samples per group). Data were tested by two-way ANOVA. e CFSE-pulsed spleen B cells from CD19-cre-Usp22 KO or WT littermates were stimulated by LPS plus IL-4 for CSR to IgG1 for 4 days. The gating (G2 to G11) is based on the intensity of CFSE and the percentage of IgG1 switch per gate is summarized (n = 3 samples per group). Data in c–e represent two independent experiments; data in a–c and e were analyzed using two-tailed unpaired Student’s t-test. Data were presented as mean ± SEM. *p < 0.05, **p < 0.01, and ***p < 0.001

