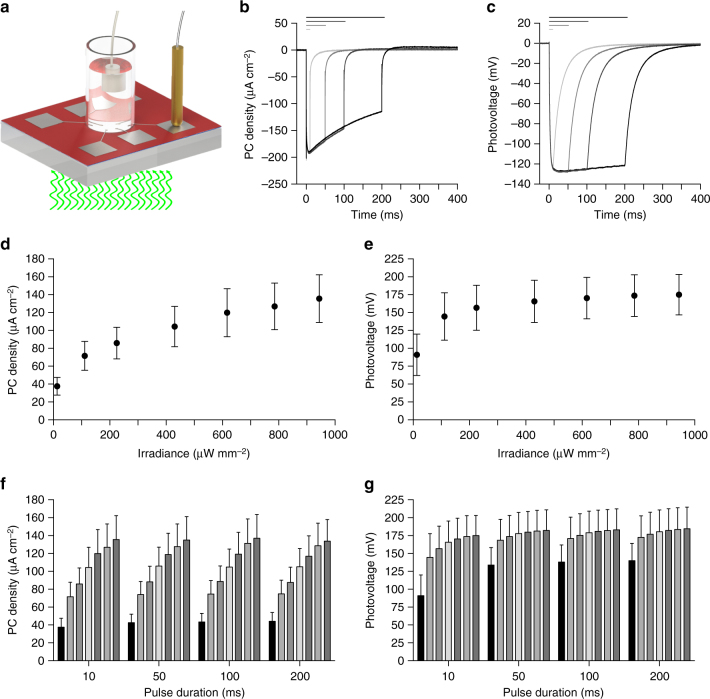
Fig. 4.
Characterization of the photo-current and photo-voltage. a Drawing of the experimental setup for the measure of PC and PV; the light pulse comes from the bottom. b, c Examples of PC density (b) and PV (c) measures obtained from 1 electrode (diameter 100 µm) at maximal light intensity (565 nm, 943.98 µW mm−2) and for increasing pulse durations (10, 50, 100, and 200 ms). Horizontal bars represent the light pulses. d,e, Mean (±s.e.m) PC density (d) and PV(e) measured upon illumination with 10 ms pulses at increasing light intensities. f, g, Mean (±s.e.m) PC density (f) and PV (g) measured for increasing light intensities (12.75, 111.11, 225.00, 430.56, 616.67, 785.65, and 943.98 µW mm−2) and pulse durations (10, 50, 100, and 200 ms). In panels d to g, the PC density and PV on every device (N = 3) has been measured for all electrodes (n = 6) and data have been averaged

