Fig. 5.
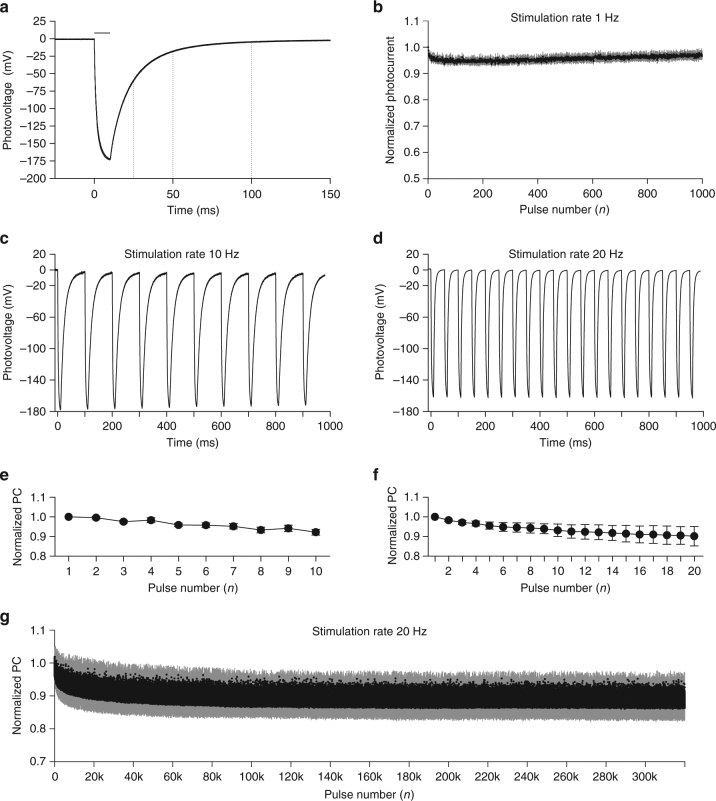
High-frequency train stimulation. a Mean PV trace obtained at maximal light intensity (565 nm, 10 ms, 943.98 µW mm−2). The trace is the mean of N = 6 devices; in which n = 6 electrodes have been measured and averaged. The horizontal bars represent the light pulse. The dotted lines highlight the discharging rate of the electrode. b Evolution of the PC density peaks during 1000 stimuli delivered at 1 Hz (10 ms, 943.98 µW mm−2). Each point is the mean (±s.e.m.) of N = 3 devices, in which n = 6 electrodes have been measured and averaged. c Representative PV recording upon 10 pulses at 10 Hz (565 nm, 10 ms, 943.98 µW/mm2). d Representative PV recording upon 20 pulses at 20 Hz (565 nm, 10 ms, 943.98 µW mm−2). e Evolution of the PC density peaks normalized to the first pulse. Each point is the mean ± s.e.m. of N = 10 devices, in which n = 6 electrodes have been measured and averaged. f Evolution of the PC density peaks normalized to the first pulse. Each point is the mean ± s.e.m. of N = 8 devices, in which n = 6 electrodes have been measured and averaged. g PC generated with 320,000 stimuli delivered at 20 Hz (565 nm, 10 ms, 943.98 µW mm−2). Each point is the mean ± s.d. of n = 2 electrodes from N = 1 device

