Fig. 6.
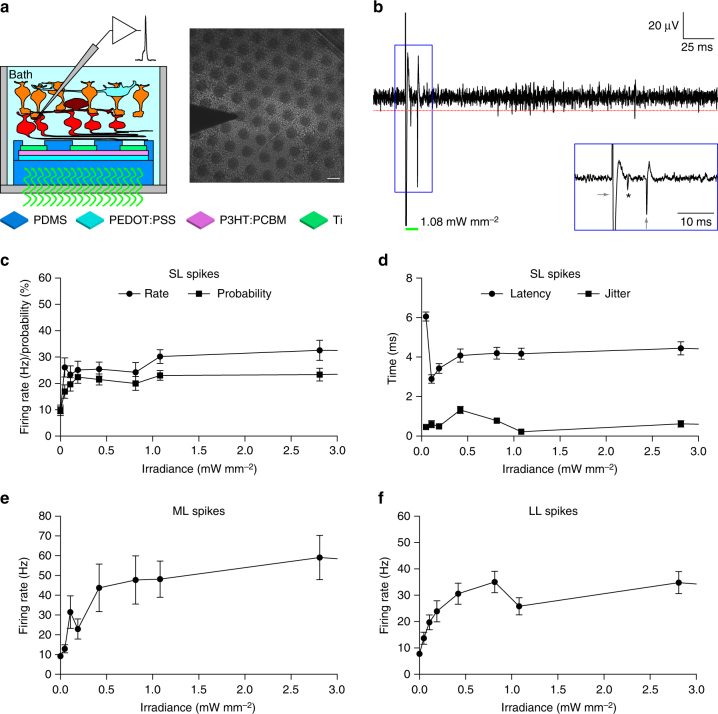
Evaluation ex vivo with retinal explants. a Sketch of the recording set-up together with a picture of a retinal explant over the PDMS–photovoltaic interface with the metal electrode used for recordings. Scale bar is 100 µm. b Representative single-sweep recording from a retinal ganglion cell over PDMS–photovoltaic interface upon 10-ms illumination at 1081.7 µW mm−2. The red dotted line is the threshold set for spike detection. The green bar represents the light pulse. The blue insert shows a magnification of the period around the light pulse. The asterisk indicates the over-threshold spike detected, while the gray arrows are the on-set and off-set stimulation artifacts. c Mean (±s.e.m.) firing rate (circles) and firing probability (squares) of SL spikes, computed across all the recorded cells (n = 39, 10 sweeps each) on the PDMS–photovoltaic interface. For each cell, the probability has been defined as the percentage of sweeps with at least a SL spike over the 10 consecutive trials. d Mean (±s.e.m.) latency (circles) and jitter (squares) of the first spike occurring in the 10 ms window after the light onset, computed across all the recorded cells (n = 39, 10 sweeps each) on the PDMS–photovoltaic interface. For each cell, the mean latency and jitter has been computed over the ten consecutive trials. e, f Mean (±s.e.m.) firing rate of medium (e) and long (f) latency spikes, computed across all the recorded cells (n = 39, ten sweeps each) on the PDMS–photovoltaic interface. In panels c–f values have been plotted up to 3 mW mm−2, while the full profiles are shown in Supplementary Fig. 3c–f

