Fig. 7.
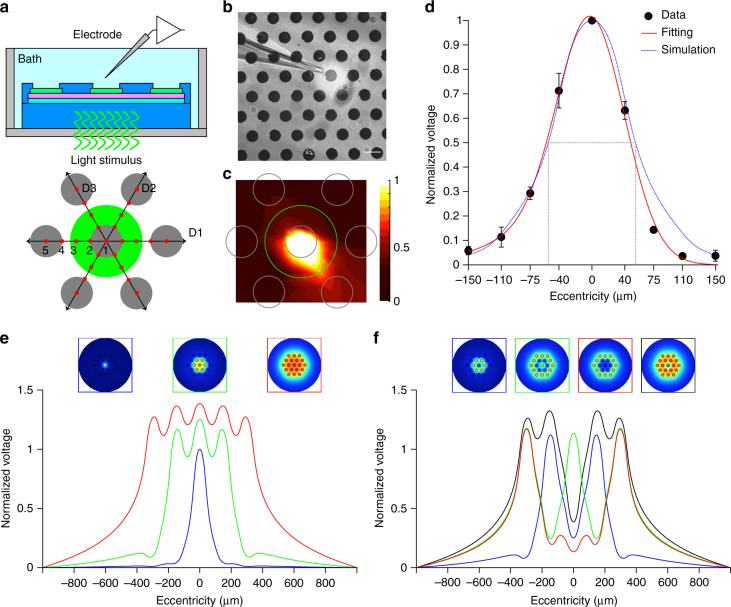
Spatial confinement of the prosthetic stimulation. a Sketch of the experimental setting. The green circle corresponds to the area illuminated around the central pixel. Gray circles represent the illuminated pixel and the six surrounding ones. The voltage has been measured in nine positions (red dots) for each direction (D1, D2, and D3), all cantered in the center of the illuminated pixel. b Picture during recordings. The light spot is visible (brighter area). The scale bar is 100 µm. c Voltage spreading colour map generated by interpolating the experimental measures with a triangulation-based linear interpolation. At each point ten consecutive recordings have been averaged and the voltage peaks have been normalized with respect to the value obtained in the central pixel (position 1 in a). The green circle is the illuminated area, while the gray circles represent the pixels. d Mean (±s.e.m.) normalized PV peaks from n = 4 pixels. For each pixel, the data from the three directions have been averaged. The red line shows a Gaussian fitting, while the blue dotted line represents the normalized voltage profile obtained by FEA simulations. The gray dotted lines show the FWHM value for the simulated profile. e FEA simulations for three beam sizes, normalized to the potential corresponding to the illumination of the single central pixel. f FEA simulations for various patterns of activation normalized to the potential corresponding to the illumination of the single central pixel

