Fig. 9.
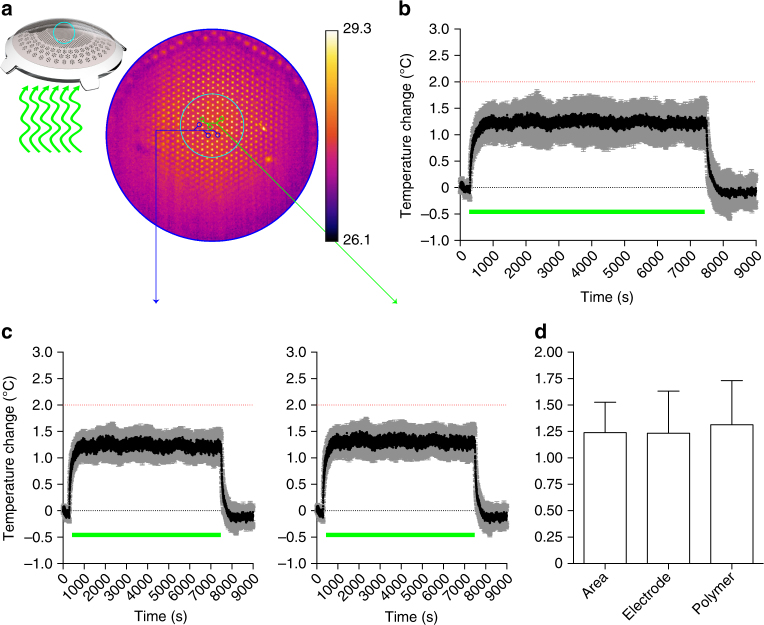
Temperature variation during operation. a The top surface of POLYRETINA has been imaged with a thermal camera while pulsed illumination has been provided from the bottom, as in the epiretinal configuration. The camera has been focused on the top electrodes and a ROI has been selected to measure the changes in surface temperature (cyan circle). Electrodes show higher value of baseline temperature because the metallic surface reflects part of the IR light used for the measurement. b Mean (±s.d.) changes in surface temperature measured in N = 4 prostheses. Data have been plotted has difference with respect to the baseline temperature measured for 5 min before pulsed illumination. The green bar represents the period of 2 h when light pulses have been applied (10 ms pulses, 20 Hz repetition rate, 1.22 mW mm−2). The dotted red line represents the maximal allowed temperature increase. c Mean (±s.e.m.) changes in surface temperature measured on the electrodes (left, N = 4 prostheses) or on the polymer area (right, N = 4 prostheses). For each prosthesis, n = 3 electrodes/areas have been sampled and averaged. d Mean (±s.d.) changes in surface temperature in the average surface, the electrode area or the polymer area are not significantly different (1.24 ± 0.29, 1.23 ± 0.20, 1.31 ± 0.21, respectively; one-way ANOVA, F = 0.0569, p = 0.9451)

