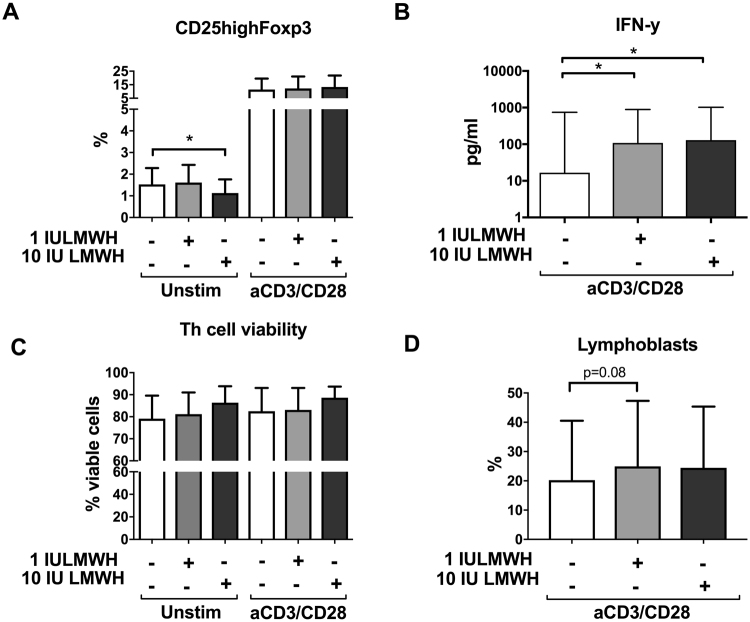
Figure 3.
Effects of LMWH on Th cells. Effects of LMWH on Th cell phenotype (A), cytokine secretion (B) and viability and activation (C,D), measured as proportion (%) of viable cells and of lymphoblasts. CD4+ T cells, both unstimulated and stimulated with anti-CD3 and anti-CD28 Abs, were cultured for 3 days in the absence or presence of 1 or 10 IU LMWH. Data are expressed as mean ± S.D. (A,C,D) and as box plots (B) showing interquartile range (box) and range (whiskers). One way ANOVA and Sidak’ s test: *p < 0.05 (A). Friedman and Wilcoxon tests (B): *p < 0.05. One way ANOVA and Sidak’ s test (C,D); (A) n = 7, (B) n = 19 (un-exposed) and n = 17 (exposed to LMWH), (C) n = 18 (un-exposed and exposed to 1 IU LMWH in T cell stimulated samples), n = 13 (exposed to 1 IU LMWH in T cell unstimulated samples), n = 10 (exposed to 10 IU LMWH in T cell unstimulated samples), n = 15 (exposed to 10 IU LMWH in T cell stimulated samples), (D) n = 15.

