Fig. 1.
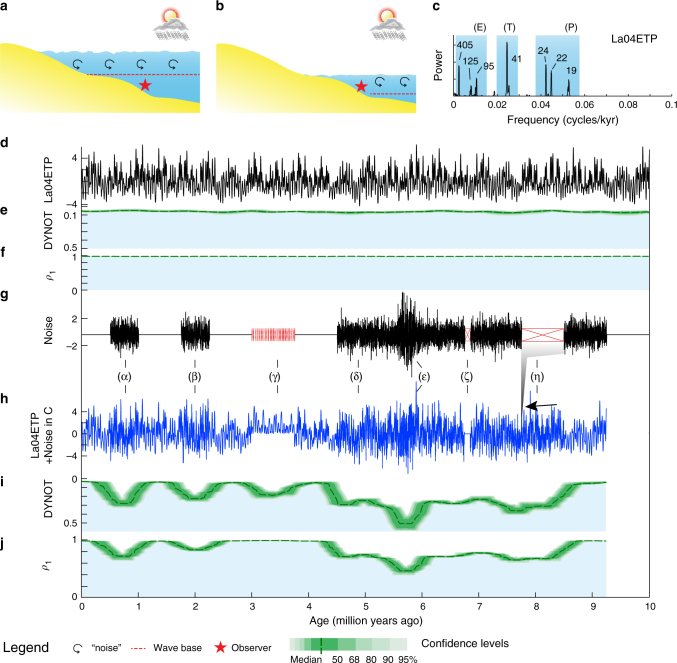
Synthetic stratigraphic noise model of sea-level variations. a High sea-level and wave base with less water depth-related ‘noise’ at location of observer. b Low sea-level and wave base with more depth-related ‘noise’ and/or gaps at location of observer. c 2π multitaper power spectrum of Laskar2004 nominal astronomical solution (La04ETP, sum of standardized eccentricity (E), obliquity, or tilt (T), and precession (P)) of 0–10 Ma plotted against the united E, T and P bands (blue shading). d La04ETP from 0 to 10 Ma. e DYNOT model of La04ETP. f ρ1 model of La04ETP. g Seven intervals with different types of noise (black) and gaps (red): (α) 500 kyr white Gaussian noise, (β) 500 kyr red noise with a ρ1 = 0.3, (γ) multiple intermittent, brief gaps, (δ) 4.75-myr white Gaussian noise with (ε) additional 500 kyr white Gaussian noise, (ζ) a 100 kyr gap, and (η) a 750-kyr gap. h Sum of La04ETP in d and the noise in g. ETP series expanded for ‘unrecognized’ gaps (γ) or zero during the ‘recognized’ gap (ζ) in g or missing during the ‘unrecognized’ gap (η). i, j DYNOT and ρ1 models of the series in h, curve minima correspond to noise in g and multiple gaps (γ) are not revealed in j. Confidence levels are estimated by a Monte Carlo analysis with 5,000 iterations and a running window of 400 kyr

