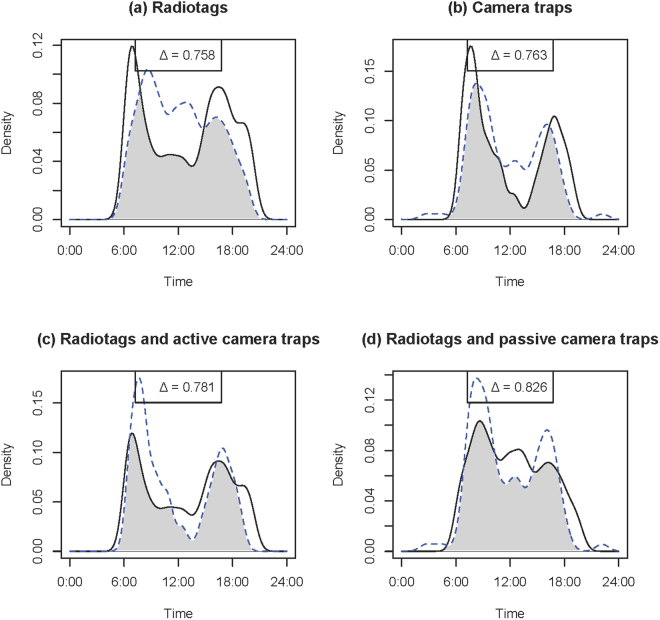
Figure 4.
Overlap plots of the activity curves of wild turkey Meleagris gallopavo estimated from (a) radiotags during August (solid line) and January-March (dotted line) (Δ = 0.758), (b) active (solid line) and passive (dotted line) camera traps (Δ = 0.763), (c) radiotag (solid line) and active camera traps (dotted line) (Δ = 0.781), and (d) radiotags (solid line) and passive camera traps (dotted line) (Δ = 0.826) at Fort Bragg, NC, 2011–2012.

