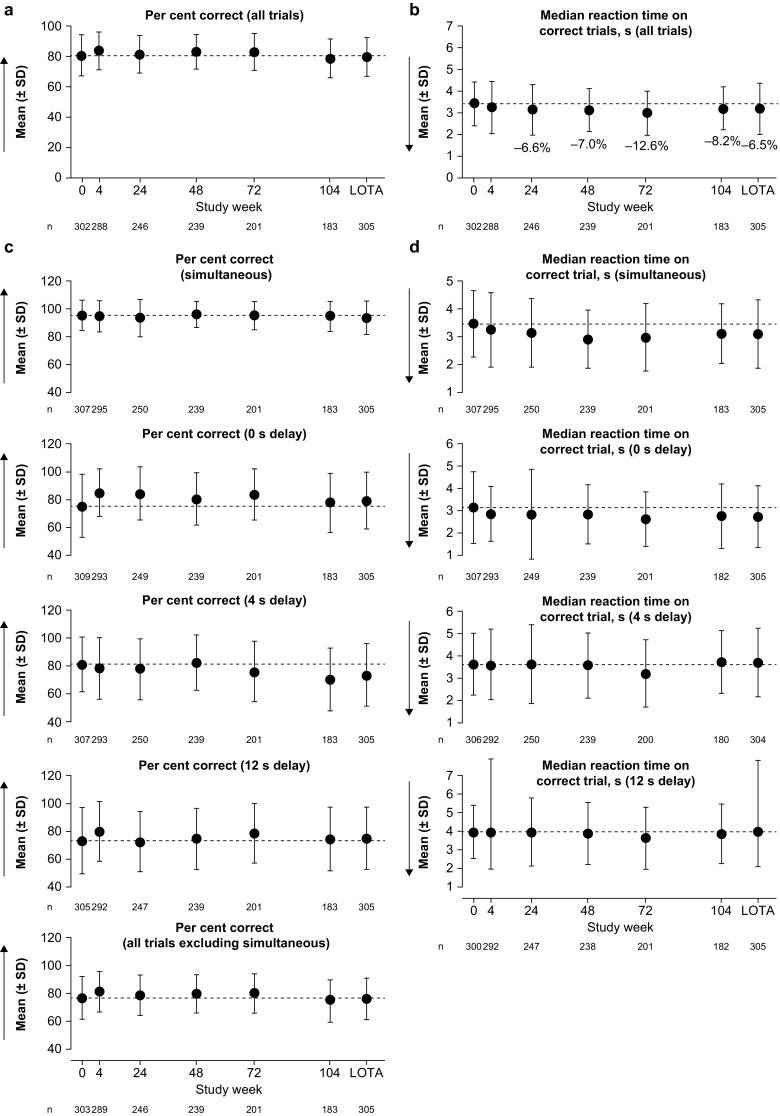
Fig. 2.

Delayed Matching to Sample outcomes: a, b key and c, d additional variables. Dashed lines indicate the mean at baseline (week 0). Arrows show the direction of improvement; higher per cent correct and lower median reaction time indicate better cognitive function. Annotated percentages indicate potentially clinically significant changes from baseline (key variables only; parts a and b). Groupwise summary data are shown in Online Resource 1. LOTA last on-treatment assessment, SD standard deviation
