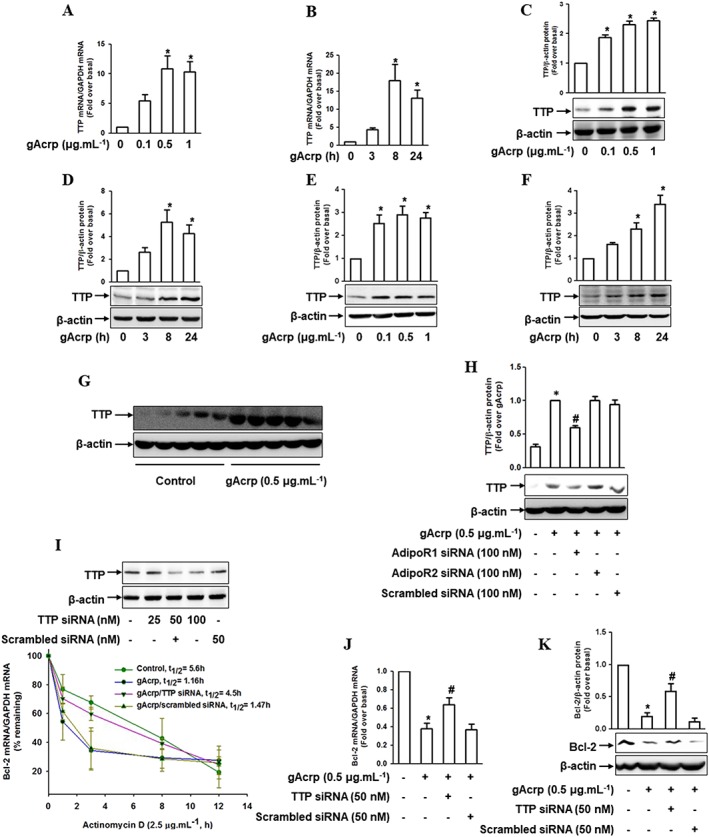
Figure 5.

Effect of gAcrp on TTP induction and the role of TTP in Bcl‐2‐mRNA destabilization by gAcrp in macrophages. (A, B) RAW 264.7 macrophages were stimulated with the indicated concentrations of gAcrp for 24 h (A) or with 0.5 μg·mL−1 of gAcrp for the indicated time points (B). The TTP mRNA levels were measured by qRT‐PCR analysis. (C, D) Cells were stimulated with different concentrations of gAcrp for 24 h (C) or with gAcrp (0.5 μg·mL−1) for the indicated periods (D). TTP protein levels were determined by Western blot analysis along with β‐actin as an internal loading control. (E, F) Murine peritoneal macrophages were stimulated with different concentrations of gAcrp for 24 h (E) or with 0.5 μg·mL−1 of gAcrp for the indicated times (F). TTP protein expression levels were measured by Western blot analysis along with β‐actin as an internal loading control. (G) Peritoneal macrophages were isolated from mice injected with gAcrp (1.5 μg.g−1 wt. of mouse), and TTP protein expression was measured by Western blot analysis. (H) RAW 264.7 macrophages were transfected with Adipo1, Adipo2 receptors’ or scrambled siRNA. After 24 h of transfection, cells were treated with gAcrp for an additional 24 h. TTP protein expression was measured by Western blot analyses. (I) RAW 264.7 macrophages were transfected with siRNA targeting TTP or with scrambled control siRNA for 24 h. The gene silencing efficiency of TTP was monitored by Western blot analysis (upper panel). After transfection with TTP siRNA, the cells were pretreated with gAcrp for 24 h and then further treated with actinomycin D (2.5 μg·mL−1) for up to 12 h. Bcl‐2 mRNA levels were measured by qPCR, and the half‐life was calculated as the percentage remaining by measuring the levels of Bcl‐2 mRNA (lower panel). (J, K) RAW 264.7 macrophages were transfected with TTP siRNA or with scrambled control siRNA for 24 h. The cells were then treated with gAcrp for 24 h. Bcl‐2 mRNA (J) and protein (K) levels were determined by qRT‐PCR and Western blot analysis respectively. In all the Western blot analyses, the representative images from at least five independent experiments are shown. Quantitative analyses of proteins were performed by densitometric analysis and the data are shown above the images. The values are expressed as mean ± SEM (n = 5). *P < 0.05 as compared with the control cells and # P < 0.05 as compared with the cells treated with gAcrp.
