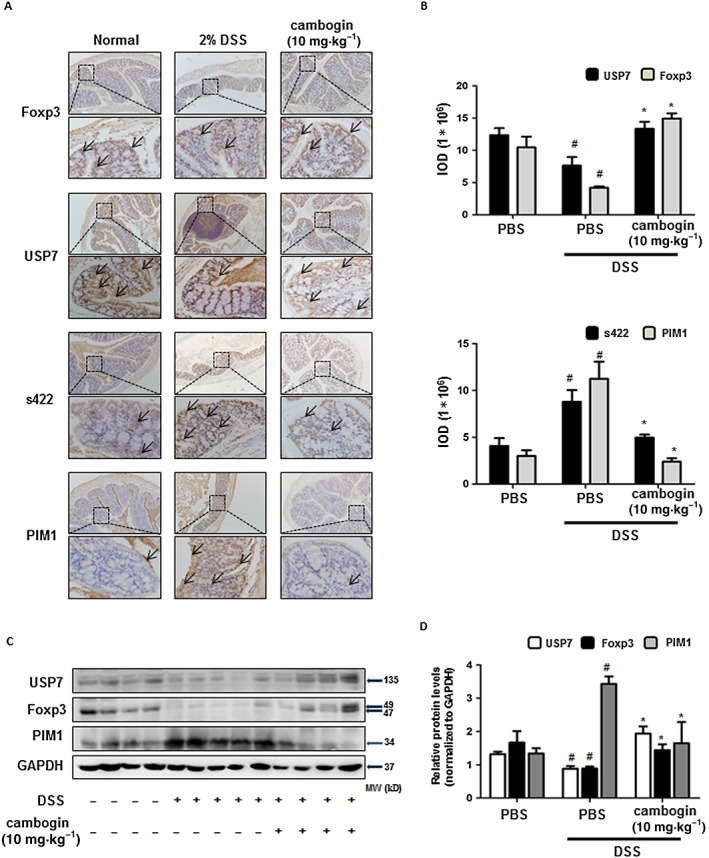
Figure 5.

Cambogin prevents Foxp3 loss in Treg cells following DSS treatment in vivo. (A) The IHC of Foxp3, USP7, phospho‐Ser422 and PIM1 were measured. The threshold values show the quantification of the integrated OD (IOD) in the different groups using Image Pro‐Plus 6.0. (C) Cells from colon tissues were used for Western blotting. The protein levels of Foxp3, USP7 and PIM1 were normalized to GAPDH by using ImageJ software. All data are presented as the means ± SEM and n = 7 in each group. Compared with normal control group, #P < 0.05; compared with DSS control group, *P < 0.05.
