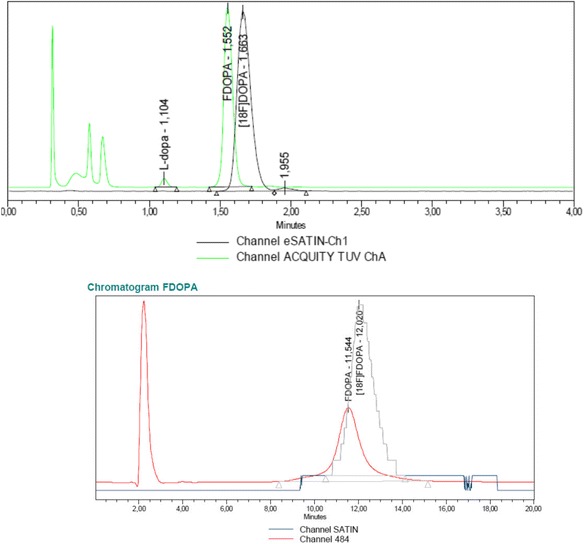
Fig. 3.

An example of a typical chromatogram of FDOPA -L performed with UPLC-UV and radioactivity detector (upper). Green is UV and the black line is RA signal. Notice that because the different detector position there is a delay in RA-signal. Below, a typical presentation of a chromatogram of FDOPA -L performed with HPLC-UV and radioactivity detector
