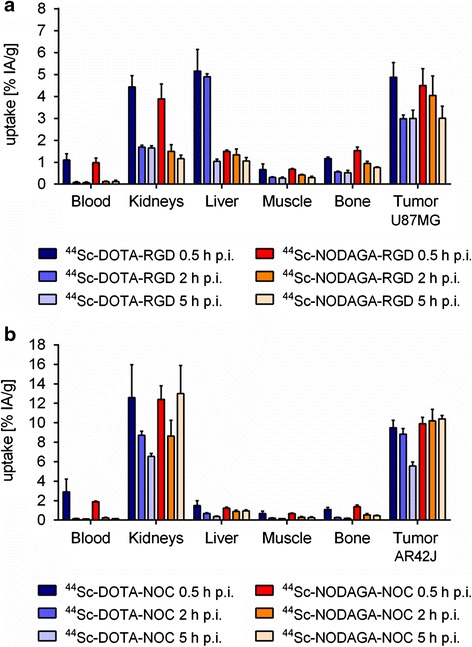
Fig. 3.

Biodistribution data obtained at different time points after injection of ~5 MBq (1 nmol) 44Sc-DOTA/NODAGA-RGD in U87MG tumor-bearing mice (a) and after injection of ~5 MBq (1 nmol) 44Sc-DOTA/NODAGA-NOC in AR42J tumor-bearing mice (b), respectively. Data bars represent the average ± SD of values obtained from n = 3 mice
