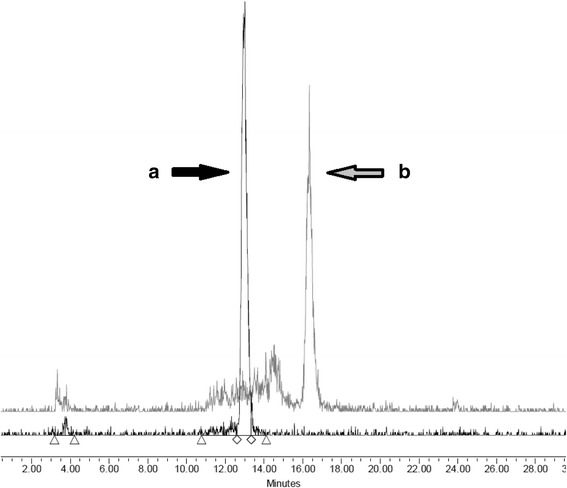
Fig. 3.

HPLC chromatogram of 213Bi-DOTATATE in presence a and absence b of ascorbic acid during labelling (n ≥ 3). Peak A; RT = 13.0 min and peak B; RT = 16.3 min. The y-axis represents the detected radioactive signals (mV) and x-axis represents the RT in minutes
