Fig. 2.

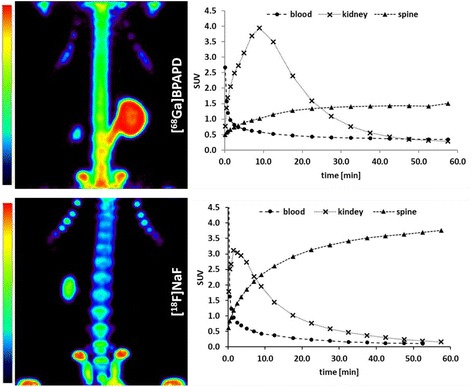
MIP (maximum intensity projection) in the thorax region of Wistar rats after 60 min p.i. and time activity curves (TAC) of [68Ga]BPAPD and [18F]NaF

MIP (maximum intensity projection) in the thorax region of Wistar rats after 60 min p.i. and time activity curves (TAC) of [68Ga]BPAPD and [18F]NaF