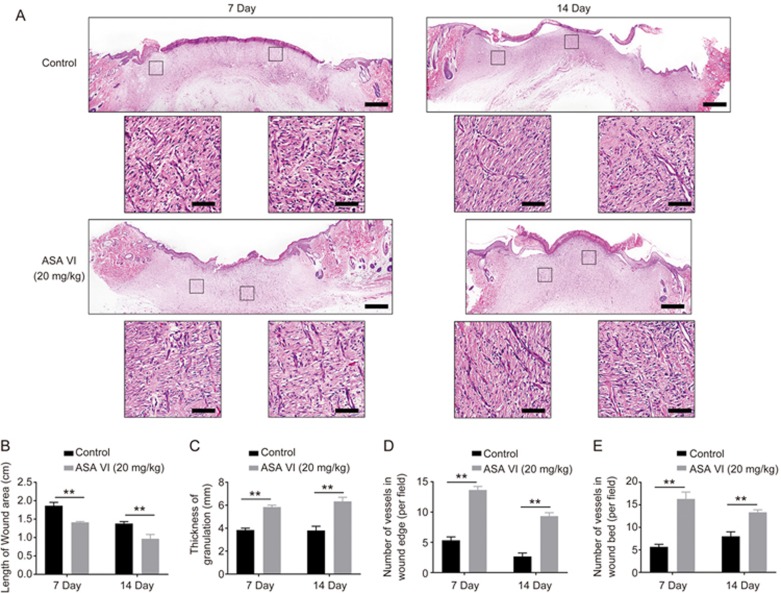
Figure 6.
ASA VI increased granulation thickness and capillary formation. (A) Representative images of H&E staining sections of wounds at 7 and 14 d post-operation (scale bar: 100 μm, 10 μm). (B, C) Quantification of the length of the wound area and the thickness of the granulation. (D, E) Quantification of the number of vessels in wound edge and wound bed. n=3 independent experiments. *P<0.05, **P<0.01.

