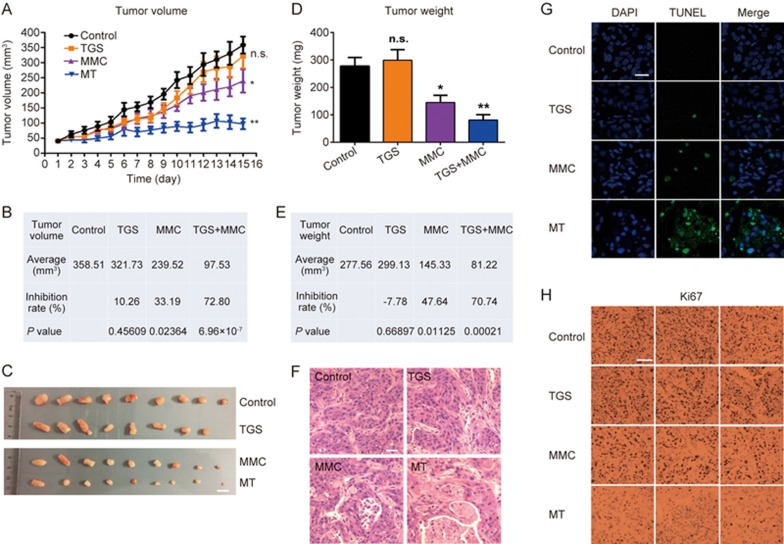
Figure 5.
Combined treatment with TGS and MMC inhibits NSCLC progression in vivo. (A) Tumor volume (mm3) of NSCLC xenografts in mice, n=8 or 9 mice for each group and vehicle control. The data are represented as the mean±SEM. NS: not significant. *P<0.05, **P<0.01 vs control (two-tailed unpaired Student's t-test). (B) The average tumor sizes and tumor inhibition rates were calculated based on tumor volumes. (C) Images of xenografts from the control, TGS, MMC and combined TGS/ MMC treatment groups at the end of the experiment. Scale bar, 1 cm. (D) Tumor weights (mg) of each group, n.s. not significant, *P<0.05, **P<0.01 vs control. Student's t-test. (E) The average tumor sizes and tumor inhibition rates according to tumor weight. (F) HE staining of tumor tissues. Scale bar, 20 μm. (G) Immunofluorescence for TUNEL staining of tumor tissues. Scale bar, 20 μm. (H) Ki67 staining of tumor tissues. The representative images are shown. Scale bar, 50 μm.

