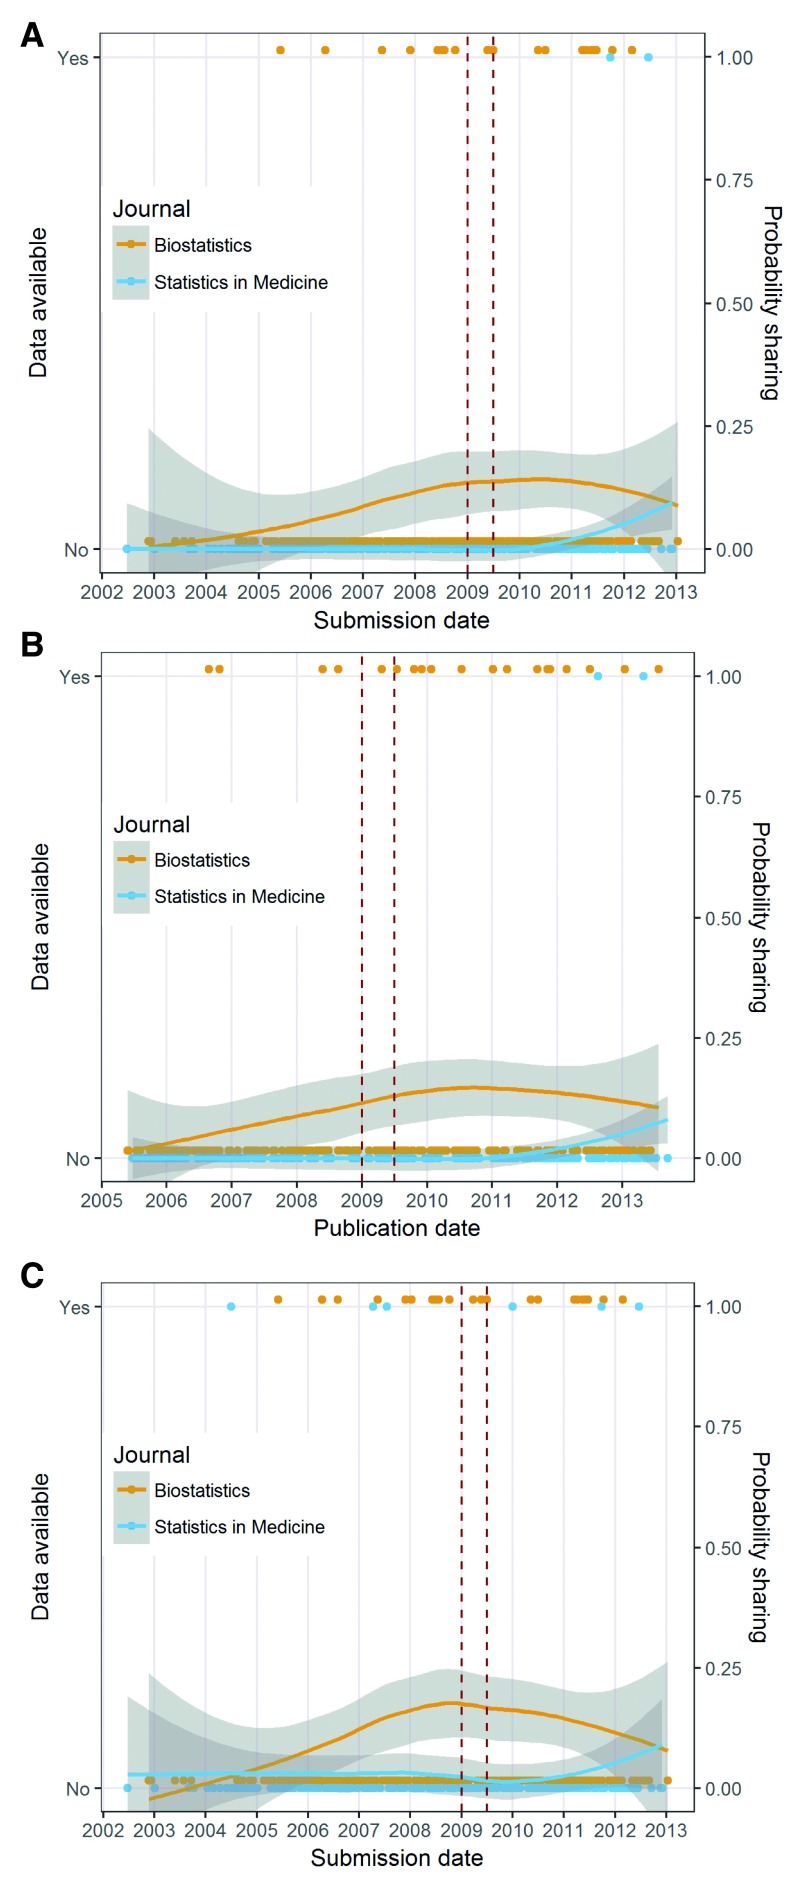
Figure 2.
a: Plot of data availability over time by submission date. The dots at ‘No’ or ‘Yes’ are individual articles and the lines are a smoothed mean using a LOESS together with 95% confidence intervals (grey areas). The red lines indicate the interim period: 1 January 2009 to 1 July 2009. b: Plot of data availability over time by publication date. The dots at ‘No’ or ‘Yes’ are individual articles and the lines are a smoothed mean using a LOESS together with 95% confidence intervals (grey areas). The red lines indicate the interim period: 1 January 2009 to 1 July 2009. c: Plot of data availability by submission date assuming the now broken links were working at the time. The dots at ‘No’ or ‘Yes’ are individual articles and the lines are a smoothed mean using a LOESS together with 95% confidence intervals (grey areas). The red lines indicate the interim period: 1 January 2009 to 1 July 2009.

