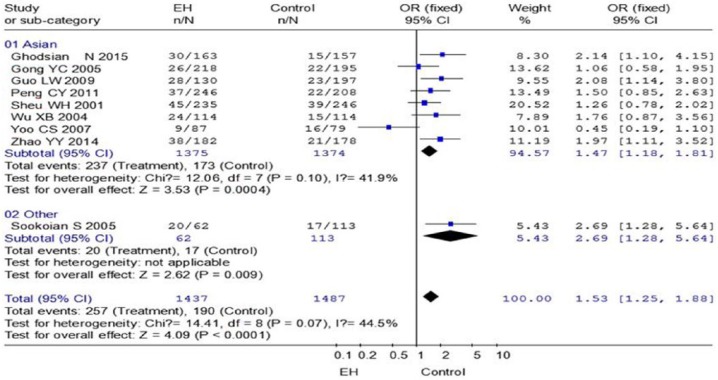
Figure 2.
Meta-analysis with a random-effects model for the association between EH risk and the TNF-a -308G/A polymorphism (AA+GA vs. GG).
The OR estimate for each study is marked with a solid black square. The size of the square represents the weight that the corresponding study exerts in the meta-analysis. The CIs of the pooled estimates are displayed as a horizontal line through the diamond; this entire line may be inside the diamond if the CI is narrow.

