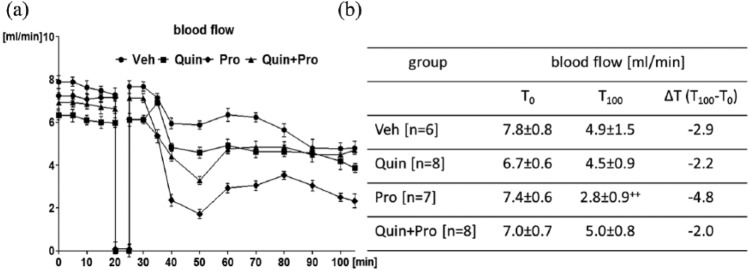
Figure 1.
Changes in the carotid blood flow (a) with the values of initial (T0) and final (T100) carotid blood flow (b) determined in Veh, Quin, Pro, and Quin+Pro rats subjected to electrical stimulation and clamping of the carotid artery between 20–25 min of the experiment. The lines represent the course of blood flow registered for 100 min after administration of Pro or Quin. T0 – beginning of the experiment, T100 – end of the experiment, after 100 min flow registration. Data are expressed as mean ± SEM. ++p <0.01 vs T0.

