
Figure 1.
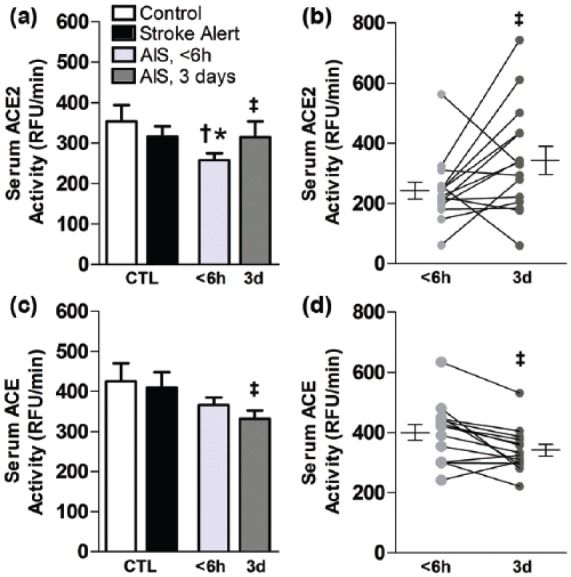
Activity of ACE2 and ACE in serum is altered following stroke. For human serum, bar graphs are means ± SEM and represent enzyme activity levels of ACE2 (a) and ACE (c) from control, stroke-alert, or AIS patients at an average of 3.6 hours and again at 3 days after stroke. Individual differences and means ± SEM in ACE2 (b) and ACE (d) are shown. *P<0.05 versus control and †P<0.05 versus stroke-alert. ‡P<0.05 versus AIS <6 hours. ACE: angiotensin converting enzyme; ACE2: angiotensin converting enzyme 2; AIS: acute ischemic stroke; RFU: relative fluorescence unit.